

Bit Digital stock extends downward move while seller pressure dominates trading

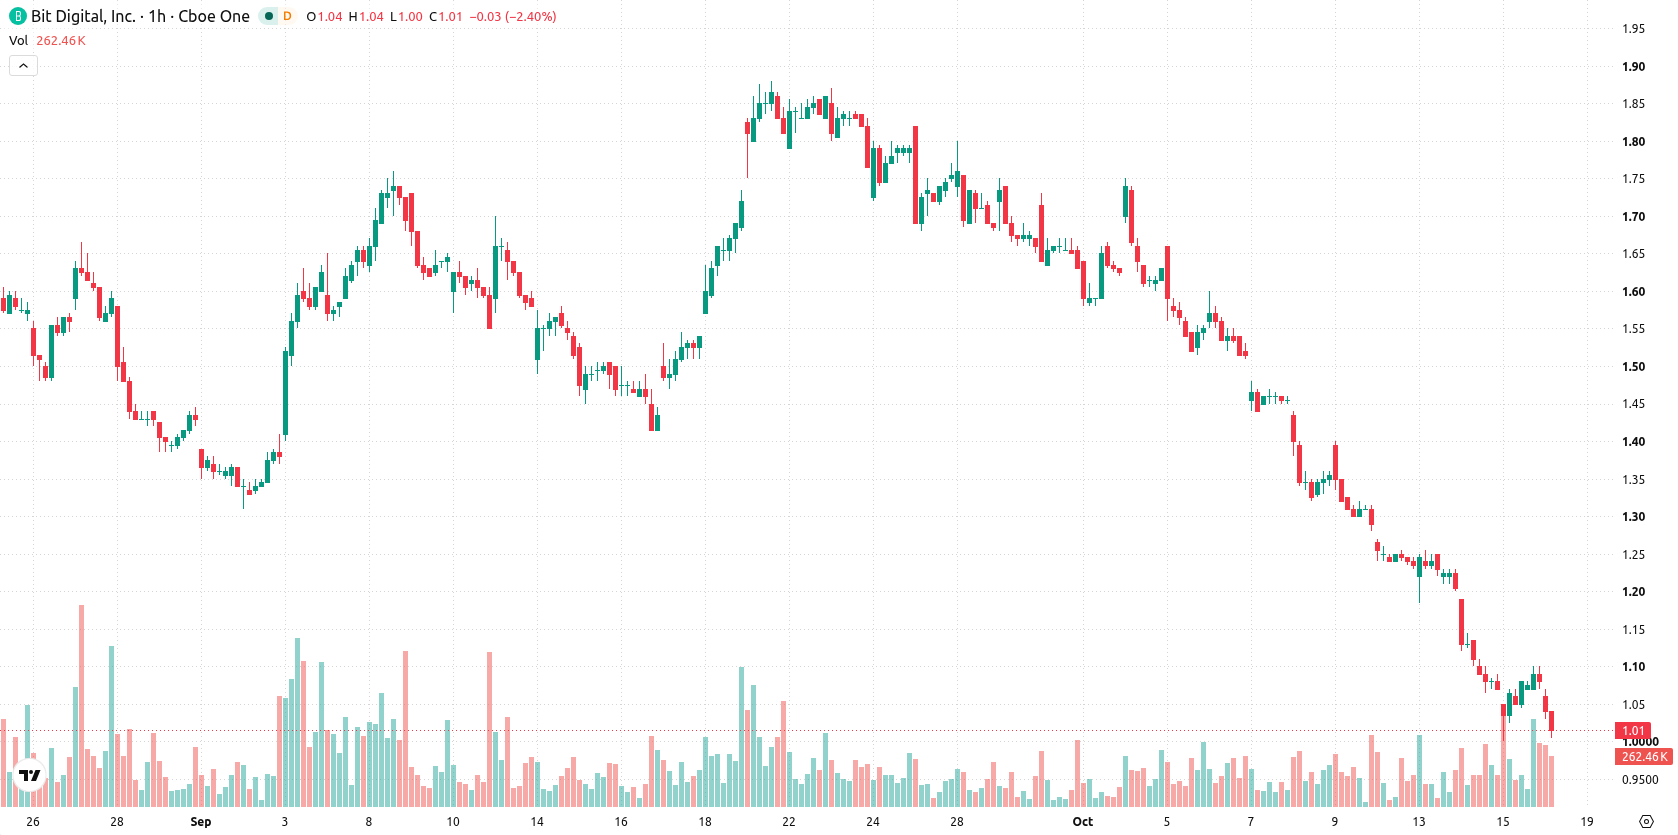
Bit Digital (BTBT) stock is trading at $1.04, down 4.15% on the day. The price sits below its key moving averages after a volatile session.
 1.07
1.27
1.07
1.27
Highlights
- BTBT stock trades below all key moving averages, confirming sustained bearish momentum across short and long timeframes.
- Price dropped 4.15% to $1.04 on a volatile day with a gap down at the open.
- Indicators overwhelmingly signal further downside, with a high probability of price ranging from $0.92 to $1.16 over the next 2 to 3 days.
Momentum signals diverge as strong sell trend persists
BTBT is trading below the MA-20 at $1.13, the MA-50 at $1.26, and the MA-200 at $1.69. The Ichimoku Kijun is set at $1.13 and marks immediate resistance. Technical momentum signals are deeply negative: both MACD and ADX remain in Strong Sell territory. The RSI stands at 31.7, indicating a sell signal, while Stochastic RSI registers an overbought condition. CCI is neutral, and the Awesome Oscillator does not currently reinforce either direction. Bull/Bear Power reveals some intraday buyer presence despite strong overall selling pressure. A notable divergence persists between classic oscillators, with RSI and other momentum indicators showing ongoing weakness, contrasted by an overbought signal from Stochastic RSI.
Further downside likely as upside probabilities remain limited
Over the next two to three sessions, BTBT is expected to trade within a $0.92 to $1.16 volatility band. The probability of a move higher is very low, with the likelihood of further declines much greater. The baseline scenario calls for sideways price action within this corridor. Should the stock close above $1.13, it could attempt a move toward the upper end of the range, while a break below $0.92 would likely accelerate further downside.
Earlier, analysts noted that Bit Digital was facing sustained bearish momentum with persistent downside risk. The latest technical signals reinforce a generally bearish scenario, with traders advised to monitor the $1.13 resistance and $0.92 support as key levels for any potential breakout or renewed downside.








-
 Afghanistan
-
 Albania
-
 Algeria
-
 Angola
-
 Argentina
-
 Armenia
-
 Australia
-
 Austria
-
 Azerbaijan
-
 Bahamas
-
 Bahrain
-
 Bangladesh
-
 Belarus
-
 Belgium
-
 Bolivia
-
 Botswana
-
 Brazil
-
 Brunei
-
 Bulgaria
-
 Cambodia
-
 Cameroon
-
 Canada
-
 Chile
Chile
-
 China
China
-
 Colombia
-
 Congo
Congo
-
 Costa Rica
-
 Cote d'Ivoire
-
 Croatia
-
 Cuba
Cuba
-
 Cyprus
-
 Czechia
-
 DR Congo
-
 Denmark
-
 Dominican Republic
-
 Ecuador
-
 Egypt
Egypt
-
 El Salvador
-
 Estonia
-
 Eswatini
-
 Ethiopia
-
 Finland
-
 France
-
 Georgia
-
 Germany
-
 Ghana
Ghana
-
 Greece
-
 Haiti
Haiti
-
 Hong Kong
-
 Hungary
-
 India
India
-
 Indonesia
-
 Iran, Islamic republic
-
 Iraq
Iraq
-
 Ireland
-
 Israel
-
 Italy
Italy
-
 Jamaica
-
 Japan
Japan
-
 Jordan
-
 Kazakhstan
-
 Kenya
Kenya
-
 Korea
Korea
-
 Kuwait
-
 Kyrgyzstan
-
 Laos
Laos
-
 Latvia
-
 Lebanon
-
 Lesotho
-
 Libya
Libya
-
 Lithuania
-
 Luxembourg
-
 Madagascar
-
 Malaysia
-
 Malta
Malta
-
 Mauritius
-
 Mexico
-
 Moldova
-
 Mongolia
-
 Montenegro
-
 Morocco
-
 Mozambique
-
 Myanmar
-
 Namibia
-
 Nepal
Nepal
-
 Netherlands
-
 New Zealand
-
 Nigeria
-
 North Macedonia
-
 Norway
-
 Oman
Oman
-
 Pakistan
-
 Palestine
-
 Panama
-
 Papua New Guinea
-
 Paraguay
-
 Peru
Peru
-
 Philippines
-
 Poland
-
 Portugal
-
 Puerto Rico
-
 Qatar
Qatar
-
 Reunion
-
 Romania
-
 Rwanda
-
 Saudi Arabia
-
 Serbia
-
 Singapore
-
 Slovakia
-
 Slovenia
-
 Somalia
-
 South Africa
-
 Spain
Spain
-
 Sri Lanka
-
 Sweden
-
 Switzerland
-
 Syria
Syria
-
 Taiwan
-
 Tajikistan
-
 Tanzania
-
 Thailand
-
 Trinidad and Tobago
-
 Tunisia
-
 Turkey
-
 UAE
UAE
-
 Uganda
-
 Ukraine
-
 United Kingdom
-
United States
-
 Uruguay
-
 Uzbekistan
-
 Venezuela
-
 Vietnam
-
 Yemen
Yemen
-
 Zambia
-
 Zimbabwe
- Forex
- Crypto












