

OKTA slides over 9% as short-term technical weakness aligns with market headwinds

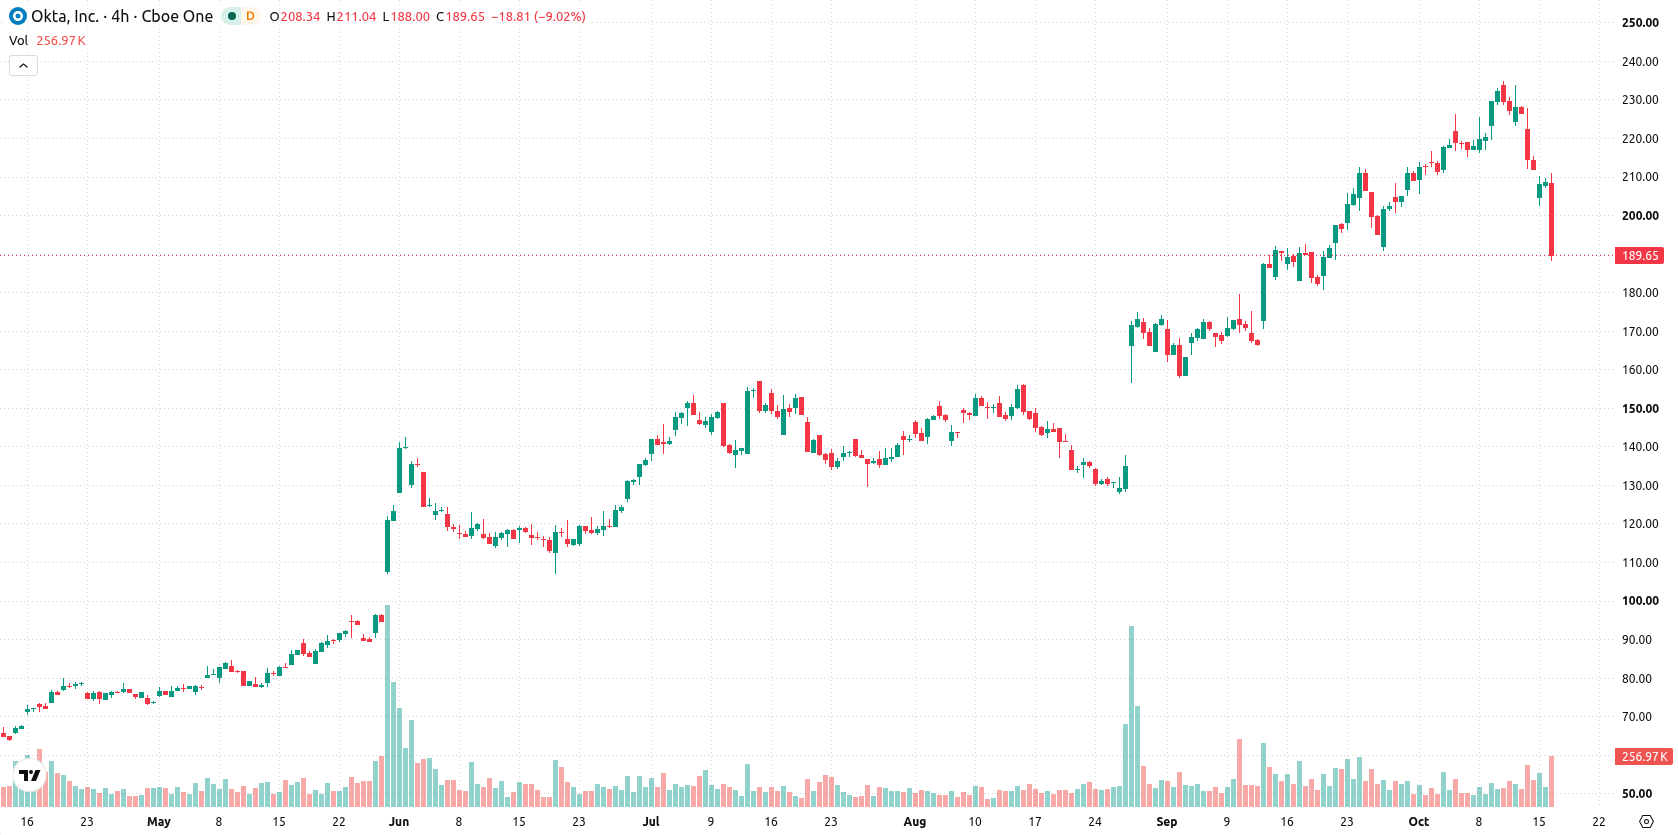
Okta Inc (OKTA) fell 9.08% after technology stocks faced renewed pressure from expectations of prolonged high interest rates and elevated inflation. The downside move is supported by short-term technical weakness, as the price now trades below its 20-day moving average while holding above medium- and long-term support.
 212.00
234.81
212.00
234.81
Highlights
- Okta reported second-quarter revenue of $805 million as its stock remains under selling pressure and well below its 2021 peak.
- Recent declines in Okta stock have been attributed to market-wide concerns over higher inflation and sustained elevated interest rates impacting technology stocks.
- Okta stock is trading below short-term averages with mixed technical signals and is forecast in the $174.57 to $212.78 range over five days.
Broader market fears deepen Okta losses despite revenue growth
Okta recently reported second-quarter revenue of $805 million. The decline in Okta's stock has been attributed to broader market concerns, including hotter-than-expected inflation data and investor expectations of sustained higher interest rates affecting technology stocks. The stock remains significantly below its February 2021 peak and, although it has outperformed the S&P 500 since its 2017 debut, price action has remained under broader selling pressure.
Mixed momentum signals as price nears support amid seller control
Okta is now trading below its 20-day moving average ($210.02) but remains above both the 50-day ($179.02) and 200-day ($118.02) moving averages, indicating a loss of short-term momentum while the medium- and long-term bias stays bullish. Immediate resistance is found at the Ichimoku Kijun ($200.52), and support lies at the 50-day moving average near $179.02. Momentum indicators are mixed: MACD and ADX still show bullish momentum, but the RSI is neutral at 54.3 and Stochastic RSI is flat at 0, highlighting oversold conditions. Intraday, bearish pressure prevails with Bear Power negative at -3.97 and an oversold forecast. CCI is neutral, and the Awesome Oscillator does not show strong directionality. Heavy pressure has pushed the stock near the session low, with volatility at 2.68%. Sellers currently control the market and indicator signals diverge.
Earlier, analysts noted that Okta was showing strong bullish momentum supported by new AI product launches, but cautioned about possible short-term retracement risks. The current technical picture adds a new dimension, as near-term weakness has emerged and traders should watch for a decisive move above $200.52 or a drop below $179.02 to signal the next directional shift.




Latest Okta Inc News





-
 Afghanistan
-
 Albania
-
 Algeria
-
 Angola
-
 Argentina
-
 Armenia
-
 Australia
-
 Austria
-
 Azerbaijan
-
 Bahamas
-
 Bahrain
-
 Bangladesh
-
 Belarus
-
 Belgium
-
 Bolivia
-
 Botswana
-
 Brazil
-
 Brunei
-
 Bulgaria
-
 Cambodia
-
 Cameroon
-
 Canada
-
 Chile
Chile
-
 China
China
-
 Colombia
-
 Congo
Congo
-
 Costa Rica
-
 Cote d'Ivoire
-
 Croatia
-
 Cuba
Cuba
-
 Cyprus
-
 Czechia
-
 DR Congo
-
 Denmark
-
 Dominican Republic
-
 Ecuador
-
 Egypt
Egypt
-
 El Salvador
-
 Estonia
-
 Eswatini
-
 Ethiopia
-
 Finland
-
 France
-
 Georgia
-
 Germany
-
 Ghana
Ghana
-
 Greece
-
 Haiti
Haiti
-
 Hong Kong
-
 Hungary
-
 India
India
-
 Indonesia
-
 Iran, Islamic republic
-
 Iraq
Iraq
-
 Ireland
-
 Israel
-
 Italy
Italy
-
 Jamaica
-
 Japan
Japan
-
 Jordan
-
 Kazakhstan
-
 Kenya
Kenya
-
 Korea
Korea
-
 Kuwait
-
 Kyrgyzstan
-
 Laos
Laos
-
 Latvia
-
 Lebanon
-
 Lesotho
-
 Libya
Libya
-
 Lithuania
-
 Luxembourg
-
 Madagascar
-
 Malaysia
-
 Malta
Malta
-
 Mauritius
-
 Mexico
-
 Moldova
-
 Mongolia
-
 Montenegro
-
 Morocco
-
 Mozambique
-
 Myanmar
-
 Namibia
-
 Nepal
Nepal
-
 Netherlands
-
 New Zealand
-
 Nigeria
-
 North Macedonia
-
 Norway
-
 Oman
Oman
-
 Pakistan
-
 Palestine
-
 Panama
-
 Papua New Guinea
-
 Paraguay
-
 Peru
Peru
-
 Philippines
-
 Poland
-
 Portugal
-
 Puerto Rico
-
 Qatar
Qatar
-
 Reunion
-
 Romania
-
 Rwanda
-
 Saudi Arabia
-
 Serbia
-
 Singapore
-
 Slovakia
-
 Slovenia
-
 Somalia
-
 South Africa
-
 Spain
Spain
-
 Sri Lanka
-
 Sweden
-
 Switzerland
-
 Syria
Syria
-
 Taiwan
-
 Tajikistan
-
 Tanzania
-
 Thailand
-
 Trinidad and Tobago
-
 Tunisia
-
 Turkey
-
 UAE
UAE
-
 Uganda
-
 Ukraine
-
 United Kingdom
-
United States
-
 Uruguay
-
 Uzbekistan
-
 Venezuela
-
 Vietnam
-
 Yemen
Yemen
-
 Zambia
-
 Zimbabwe
- Forex
- Crypto












