

American Airlines shares technical analysis: Seller pressure dominates despite mixed momentum signals

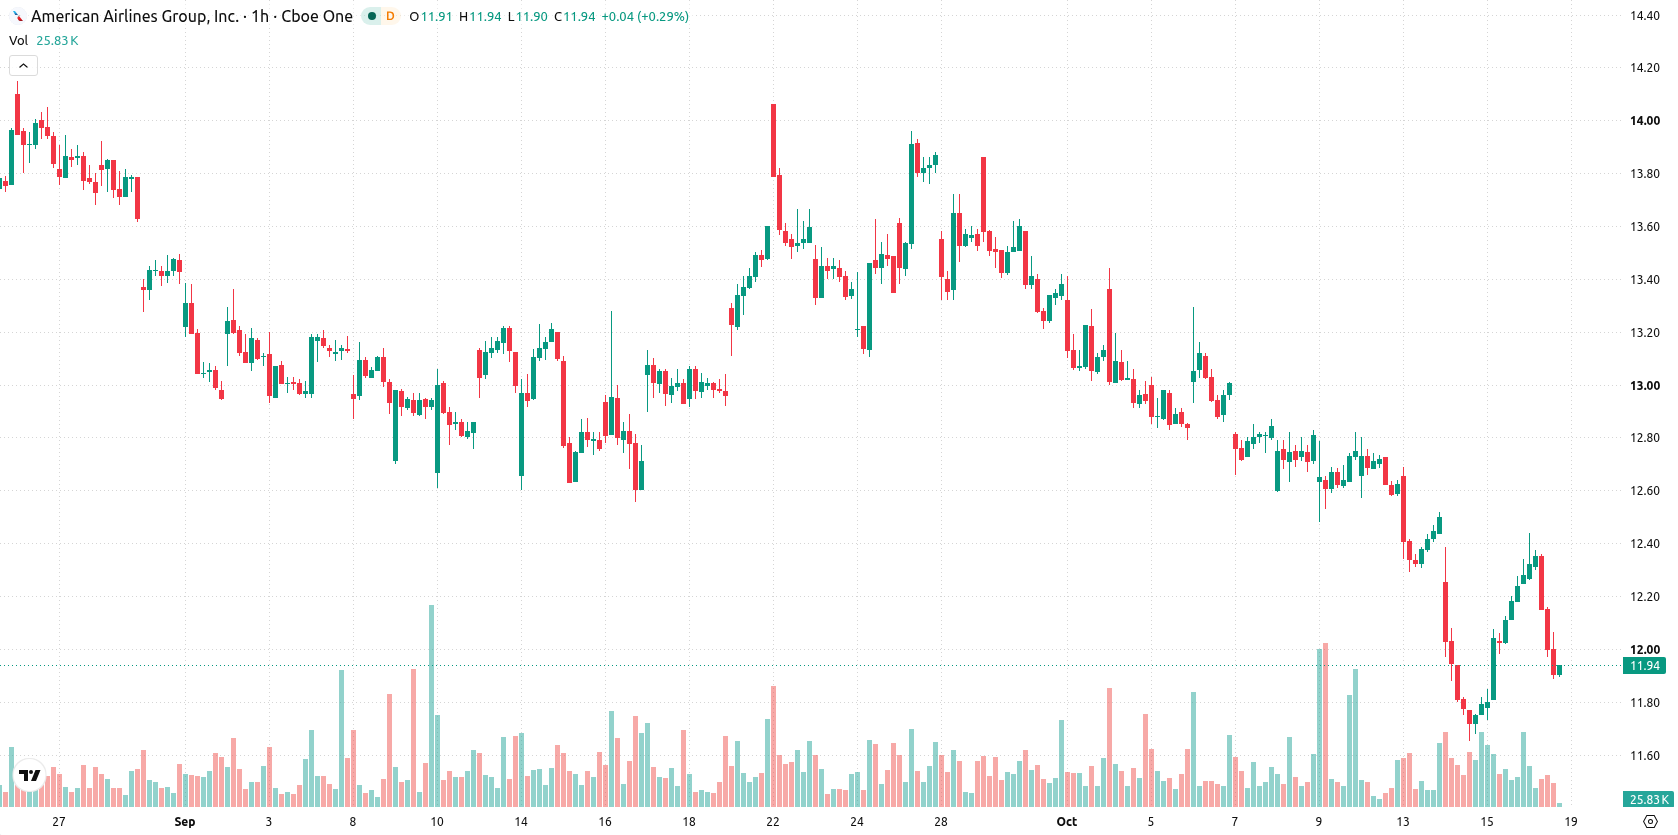
American Airlines (AAL) stock is trading at $11.93 after dropping 3.05% for the session. The price remains below its key moving averages, reflecting persistent seller control across both short- and long-term timeframes.
 12.44
12.80
12.44
12.80
Highlights
- American Airlines appointed a new network planning chief as part of a leadership overhaul to improve profitability.
- The executive reshuffle may alter the airline's network strategy and cost structure as it aims to refine operations.
- Shares of American Airlines fell 3.05% to $11.93 with persistent seller pressure and a projected range of $11.42 to $12.51.
Leadership reshuffle aims to drive profitability amid industry headwinds
American Airlines has undertaken a significant leadership reshuffle, appointing a new network planning chief as part of efforts to improve profitability, according to Investing.com. Such executive changes may influence the airline’s network strategy and cost structure, with the intent of refining operational performance. The strategic overhaul comes amid broader industry pressures that could shape the company’s outlook.
Mixed momentum signals highlight divergence from persistent price weakness
On the technical front, AAL/USD is trading below its MA-20 and MA-50 on the H1 chart, while also remaining under the MA-200 on the daily timeframe. The Ichimoku Kijun at $12.17 serves as near-term resistance. Momentum signals are mixed: ADX indicates a potential buy, while MACD remains in strong sell territory. RSI is modestly bullish at 50.51, Stochastic RSI registers as overbought, and CCI shows a buy signal. Bull/Bear Power confirms intraday buyer dominance, and the Awesome Oscillator strongly supports the prevailing trend. Notably, daily losses occurred despite some bullish oscillator readings, reflecting divergence between momentum and price action.
Sideways outlook holds with downside risk dominating short-term range
Looking ahead to the next few sessions, AAL is likely to fluctuate between $11.42 and $12.51, reflecting a typical volatility band relative to current levels. There is a 78% probability of a downside move versus only a 22% chance for upward momentum. The baseline scenario anticipates sideways churn within the existing range. Should the price break above the $12.17 resistance, recovery toward the upper boundary may follow; conversely, renewed bearish momentum could see a push toward the lower end of the corridor.
Earlier, analysts noted that persistently high jet fuel prices and uncertain hedging strategies have weighed on airline sector profitability and forced a broader rethink of operating models. The recent leadership changes at American Airlines add another layer of uncertainty to the stock, making the $12.17 resistance a critical level for traders monitoring potential shifts in direction amid ongoing industry headwinds.




Latest American Airlines News






-
 Afghanistan
-
 Albania
-
 Algeria
-
 Angola
-
 Argentina
-
 Armenia
-
 Australia
-
 Austria
-
 Azerbaijan
-
 Bahamas
-
 Bahrain
-
 Bangladesh
-
 Belarus
-
 Belgium
-
 Bolivia
-
 Botswana
-
 Brazil
-
 Brunei
-
 Bulgaria
-
 Cambodia
-
 Cameroon
-
 Canada
-
 Chile
Chile
-
 China
China
-
 Colombia
-
 Congo
Congo
-
 Costa Rica
-
 Cote d'Ivoire
-
 Croatia
-
 Cuba
Cuba
-
 Cyprus
-
 Czechia
-
 DR Congo
-
 Denmark
-
 Dominican Republic
-
 Ecuador
-
 Egypt
Egypt
-
 El Salvador
-
 Estonia
-
 Eswatini
-
 Ethiopia
-
 Finland
-
 France
-
 Georgia
-
 Germany
-
 Ghana
Ghana
-
 Greece
-
 Haiti
Haiti
-
 Hong Kong
-
 Hungary
-
 India
India
-
 Indonesia
-
 Iran, Islamic republic
-
 Iraq
Iraq
-
 Ireland
-
 Israel
-
 Italy
Italy
-
 Jamaica
-
 Japan
Japan
-
 Jordan
-
 Kazakhstan
-
 Kenya
Kenya
-
 Korea
Korea
-
 Kuwait
-
 Kyrgyzstan
-
 Laos
Laos
-
 Latvia
-
 Lebanon
-
 Lesotho
-
 Libya
Libya
-
 Lithuania
-
 Luxembourg
-
 Madagascar
-
 Malaysia
-
 Malta
Malta
-
 Mauritius
-
 Mexico
-
 Moldova
-
 Mongolia
-
 Montenegro
-
 Morocco
-
 Mozambique
-
 Myanmar
-
 Namibia
-
 Nepal
Nepal
-
 Netherlands
-
 New Zealand
-
 Nigeria
-
 North Macedonia
-
 Norway
-
 Oman
Oman
-
 Pakistan
-
 Palestine
-
 Panama
-
 Papua New Guinea
-
 Paraguay
-
 Peru
Peru
-
 Philippines
-
 Poland
-
 Portugal
-
 Puerto Rico
-
 Qatar
Qatar
-
 Reunion
-
 Romania
-
 Rwanda
-
 Saudi Arabia
-
 Serbia
-
 Singapore
-
 Slovakia
-
 Slovenia
-
 Somalia
-
 South Africa
-
 Spain
Spain
-
 Sri Lanka
-
 Sweden
-
 Switzerland
-
 Syria
Syria
-
 Taiwan
-
 Tajikistan
-
 Tanzania
-
 Thailand
-
 Trinidad and Tobago
-
 Tunisia
-
 Turkey
-
 UAE
UAE
-
 Uganda
-
 Ukraine
-
 United Kingdom
-
United States
-
 Uruguay
-
 Uzbekistan
-
 Venezuela
-
 Vietnam
-
 Yemen
Yemen
-
 Zambia
-
 Zimbabwe
- Forex
- Crypto












