

HSBC stock forecast: Sideways consolidation likely amid mixed momentum signals

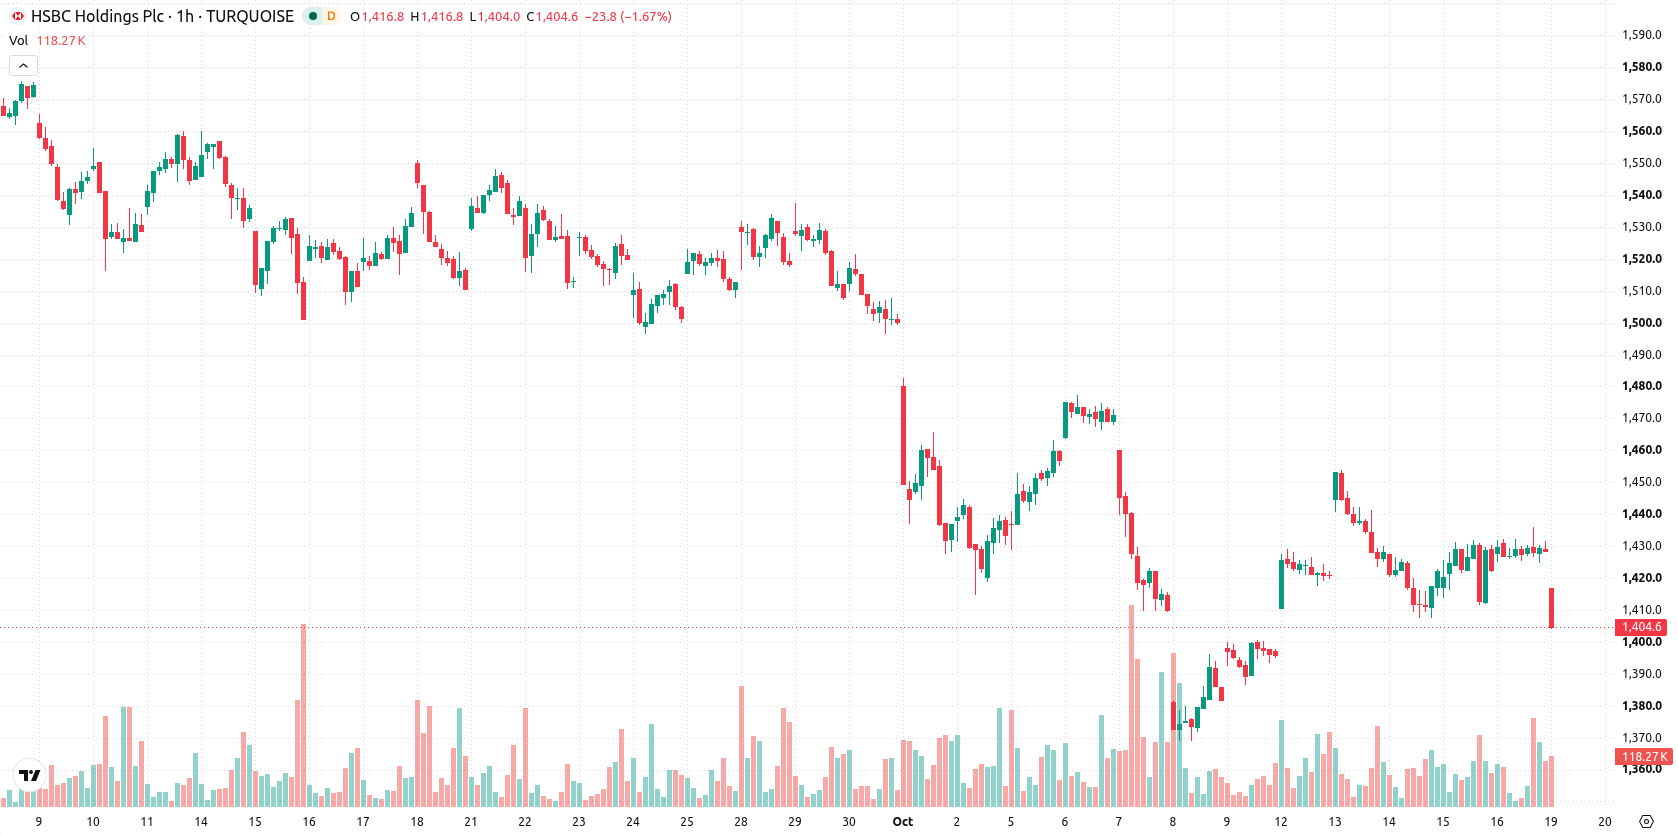
HSBC (HSBA) stock is trading at GBX1,428, posting a modest gain today. The price remains above its key moving averages, indicating continued momentum over multiple timeframes.
 1337.60
1341.20
Highlights
- Shares of HSBC Holdings trade in a bullish technical structure above short-, medium-, and long-term moving averages.
- Momentum and oscillator indicators are mixed, with most signaling buy but some showing overbought or modest trend strength.
- Price sits at GBX1,428 with support at GBX1,421, and the expected 2 to 3 day range is GBX1,407 to GBX1,448.
Mixed momentum signals amid persistent technical support
On the technical side, HSBA is positioned above the MA-20 (GBX1,425) and MA-50 (GBX1,423) on the hourly chart, as well as comfortably above the longer-term MA-200 (GBX1,382, daily basis). Immediate support is defined by the Ichimoku Kijun level at GBX1,421. Among momentum indicators, the MACD issues a Buy signal and CCI also points to Buy, while ADX is neutral and Stochastic RSI suggests Sell. RSI stands at 52.36. Bull/Bear Power points to an overbought condition intraday, and the Awesome Oscillator maintains a Buy stance. This mix highlights divergence among oscillators and signals, despite the current technical structure.
Directional probabilities shift as price approaches technical thresholds
Over the next two to three trading days, HSBA is expected to consolidate within a GBX1,407 to GBX1,448 volatility band. The probability of an upward move is 64%, while the chance of a downward reversal stands at 36%. A breakout above resistance could trigger further upside, whereas a break below GBX1,421 may begin to favor a bearish scenario.
Previously it was reported that HSBC's technical outlook was mixed, with momentum indicators reflecting conflicting signals and a cautious, consolidation-focused bias. The current analysis strengthens this perspective, highlighting persistent divergence among technical indicators and positioning immediate support at GBX1,421 as a pivotal level for traders to monitor in the coming sessions.









-
 Afghanistan
-
 Albania
-
 Algeria
-
 Angola
-
 Argentina
-
 Armenia
-
 Australia
-
 Austria
-
 Azerbaijan
-
 Bahamas
-
 Bahrain
-
 Bangladesh
-
 Belarus
-
 Belgium
-
 Bolivia
-
 Botswana
-
 Brazil
-
 Brunei
-
 Bulgaria
-
 Cambodia
-
 Cameroon
-
 Canada
-
 Chile
-
 China
-
 Colombia
-
 Congo
-
 Costa Rica
-
 Cote d'Ivoire
-
 Croatia
-
 Cuba
-
 Cyprus
-
 Czechia
-
 DR Congo
-
 Denmark
-
 Dominican Republic
-
 Ecuador
-
 Egypt
-
 El Salvador
-
 Estonia
-
 Eswatini
-
 Ethiopia
-
 Finland
-
 France
-
 Georgia
-
 Germany
-
 Ghana
-
 Greece
-
 Haiti
-
 Hong Kong
-
 Hungary
-
 India
-
 Indonesia
-
 Iran, Islamic republic
-
 Iraq
-
 Ireland
-
 Israel
-
 Italy
-
 Jamaica
-
 Japan
-
 Jordan
-
 Kazakhstan
-
 Kenya
-
 Korea
-
 Kuwait
-
 Kyrgyzstan
-
 Laos
-
 Latvia
-
 Lebanon
-
 Lesotho
-
 Libya
-
 Lithuania
-
 Luxembourg
-
 Madagascar
-
 Malaysia
-
 Malta
-
 Mauritius
-
 Mexico
-
 Moldova
-
 Mongolia
-
 Montenegro
-
 Morocco
-
 Mozambique
-
 Myanmar
-
 Namibia
-
 Nepal
-
 Netherlands
-
 New Zealand
-
 Nigeria
-
 North Macedonia
-
 Norway
-
 Oman
-
 Pakistan
-
 Palestine
-
 Panama
-
 Papua New Guinea
-
 Paraguay
-
 Peru
-
 Philippines
-
 Poland
-
 Portugal
-
 Puerto Rico
-
 Qatar
-
 Reunion
-
 Romania
-
 Rwanda
-
 Saudi Arabia
-
 Serbia
-
 Singapore
-
 Slovakia
-
 Slovenia
-
 Somalia
-
 South Africa
-
 Spain
-
 Sri Lanka
-
 Sweden
-
 Switzerland
-
 Syria
-
 Taiwan
-
 Tajikistan
-
 Tanzania
-
 Thailand
-
 Trinidad and Tobago
-
 Tunisia
-
 Turkey
-
 UAE
-
 Uganda
-
 Ukraine
-
 United Kingdom
-
United States
-
 Uruguay
-
 Uzbekistan
-
 Venezuela
-
 Vietnam
-
 Yemen
-
 Zambia
-
 Zimbabwe
- Forex
- Crypto












