

HSBC rises as upward price move draws buyers toward key resistance

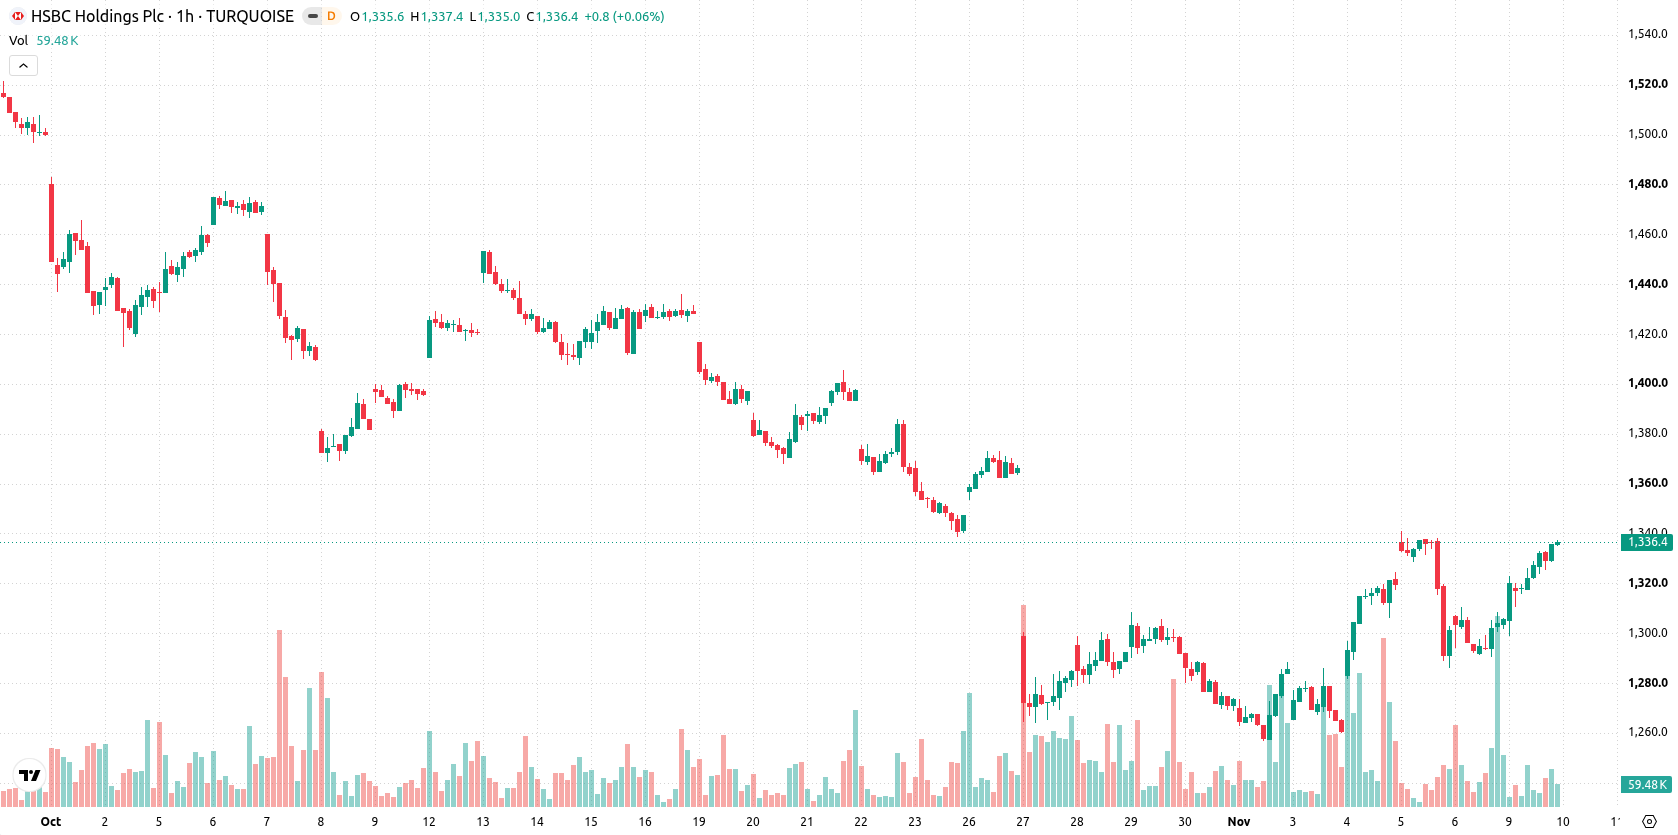
HSBC (HSBA.L) stock is trading at GBX1,336, up 2.45% on the day. The move positions the shares above key short- and medium-term moving averages, reflecting underlying buying interest.
 1265.20
1363.20
Highlights
- HSBC repurchased and cancelled 1,410,000 shares on November 9, 2026 and has withdrawn nearly 9 million shares since late October, allocating about $156 million to buybacks.
- UK revenue rose 7% year on year to $15.6 billion in the first nine months of 2026, but the CET1 capital ratio decreased to 13.9%.
- HSBC stock trades above short- and medium-term moving averages with most indicators on buy, forecast to consolidate within GBX1,299 to GBX1,373 over the next 2 to 3 days.
Buyback-fueled float reduction supports upside as CET1 ratio slips
HSBC's ongoing share repurchase and recent cancellation of 1,410,000 ordinary shares on November 9, 2026, mechanically reduces the outstanding float and bolsters per-share metrics, directly supporting the current upward price move. Since late October, the bank has withdrawn nearly 9 million shares from the market via its buy-back program, allocating approximately US$156 million to these efforts, according to Investegate Co. Additional support comes from a 7% year-on-year rise in UK revenue to $15.6 billion over the first nine months of 2026, as reported by TradingView, reflecting expanding loan and deposit bases. However, the CET1 capital ratio slipping to 13.9% may limit future capital returns, slightly tempering the otherwise bullish capital management narrative.
Momentum signals diverge as overbought risk challenges bullish bias
On the hourly chart, price trades above the SMA-20 at GBX1,311 and SMA-50 at GBX1,303, yet remains below the longer-term SMA-200 at GBX1,390. The Ichimoku Kijun provides immediate support at GBX1,312. Momentum indicators are firm, with MACD and ADX registering Buy signals and the Awesome Oscillator confirming upwards strength. Among oscillators, RSI shows a neutral stance, while both the Stochastic RSI and CCI sit in overbought territory, highlighting a potential risk of short-term overheating. Bull/Bear Power is positive at 14.77, reinforcing the current dominance of buyers. The divergence between neutral RSI and overbought signals from Stochastic RSI and CCI suggests a split momentum picture and raises the probability of a near-term pullback even as buyers maintain control.
Consolidation likely as breakout and pullback risks shape outlook
Over the next two to three trading days, HSBC is expected to consolidate within a GBX1,299 to GBX1,373 range, reflecting a typical volatility band relative to current levels. There is a 70% probability of an upward move, with a less likely bearish scenario at 30%. A break above resistance could attract renewed buying momentum, while a dip below support would point to profit-taking or a corrective pullback.
Earlier, analysts noted that HSBC was exhibiting a mixed technical outlook with the potential for consolidation and a shift toward a bullish bias. The current analysis strengthens this view, as robust buy signals and improving fundamentals support a scenario favoring an upward move, making the breakout above recent resistance a key level for traders to monitor.










-
 Afghanistan
-
 Albania
-
 Algeria
-
 Angola
-
 Argentina
-
 Armenia
-
 Australia
-
 Austria
-
 Azerbaijan
-
 Bahamas
-
 Bahrain
-
 Bangladesh
-
 Belarus
-
 Belgium
-
 Bolivia
-
 Botswana
-
 Brazil
-
 Brunei
-
 Bulgaria
-
 Cambodia
-
 Cameroon
-
 Canada
-
 Chile
-
 China
-
 Colombia
-
 Congo
-
 Costa Rica
-
 Cote d'Ivoire
-
 Croatia
-
 Cuba
-
 Cyprus
-
 Czechia
-
 DR Congo
-
 Denmark
-
 Dominican Republic
-
 Ecuador
-
 Egypt
-
 El Salvador
-
 Estonia
-
 Eswatini
-
 Ethiopia
-
 Finland
-
 France
-
 Georgia
-
 Germany
-
 Ghana
-
 Greece
-
 Haiti
-
 Hong Kong
-
 Hungary
-
 India
-
 Indonesia
-
 Iran, Islamic republic
-
 Iraq
-
 Ireland
-
 Israel
-
 Italy
-
 Jamaica
-
 Japan
-
 Jordan
-
 Kazakhstan
-
 Kenya
-
 Korea
-
 Kuwait
-
 Kyrgyzstan
-
 Laos
-
 Latvia
-
 Lebanon
-
 Lesotho
-
 Libya
-
 Lithuania
-
 Luxembourg
-
 Madagascar
-
 Malaysia
-
 Malta
-
 Mauritius
-
 Mexico
-
 Moldova
-
 Mongolia
-
 Montenegro
-
 Morocco
-
 Mozambique
-
 Myanmar
-
 Namibia
-
 Nepal
-
 Netherlands
-
 New Zealand
-
 Nigeria
-
 North Macedonia
-
 Norway
-
 Oman
-
 Pakistan
-
 Palestine
-
 Panama
-
 Papua New Guinea
-
 Paraguay
-
 Peru
-
 Philippines
-
 Poland
-
 Portugal
-
 Puerto Rico
-
 Qatar
-
 Reunion
-
 Romania
-
 Rwanda
-
 Saudi Arabia
-
 Serbia
-
 Singapore
-
 Slovakia
-
 Slovenia
-
 Somalia
-
 South Africa
-
 Spain
-
 Sri Lanka
-
 Sweden
-
 Switzerland
-
 Syria
-
 Taiwan
-
 Tajikistan
-
 Tanzania
-
 Thailand
-
 Trinidad and Tobago
-
 Tunisia
-
 Turkey
-
 UAE
-
 Uganda
-
 Ukraine
-
 United Kingdom
-
United States
-
 Uruguay
-
 Uzbekistan
-
 Venezuela
-
 Vietnam
-
 Yemen
-
 Zambia
-
 Zimbabwe
- Forex
- Crypto












