

National Grid stock falls around 1.5% as near-term selling pressure persists despite bullish technicals

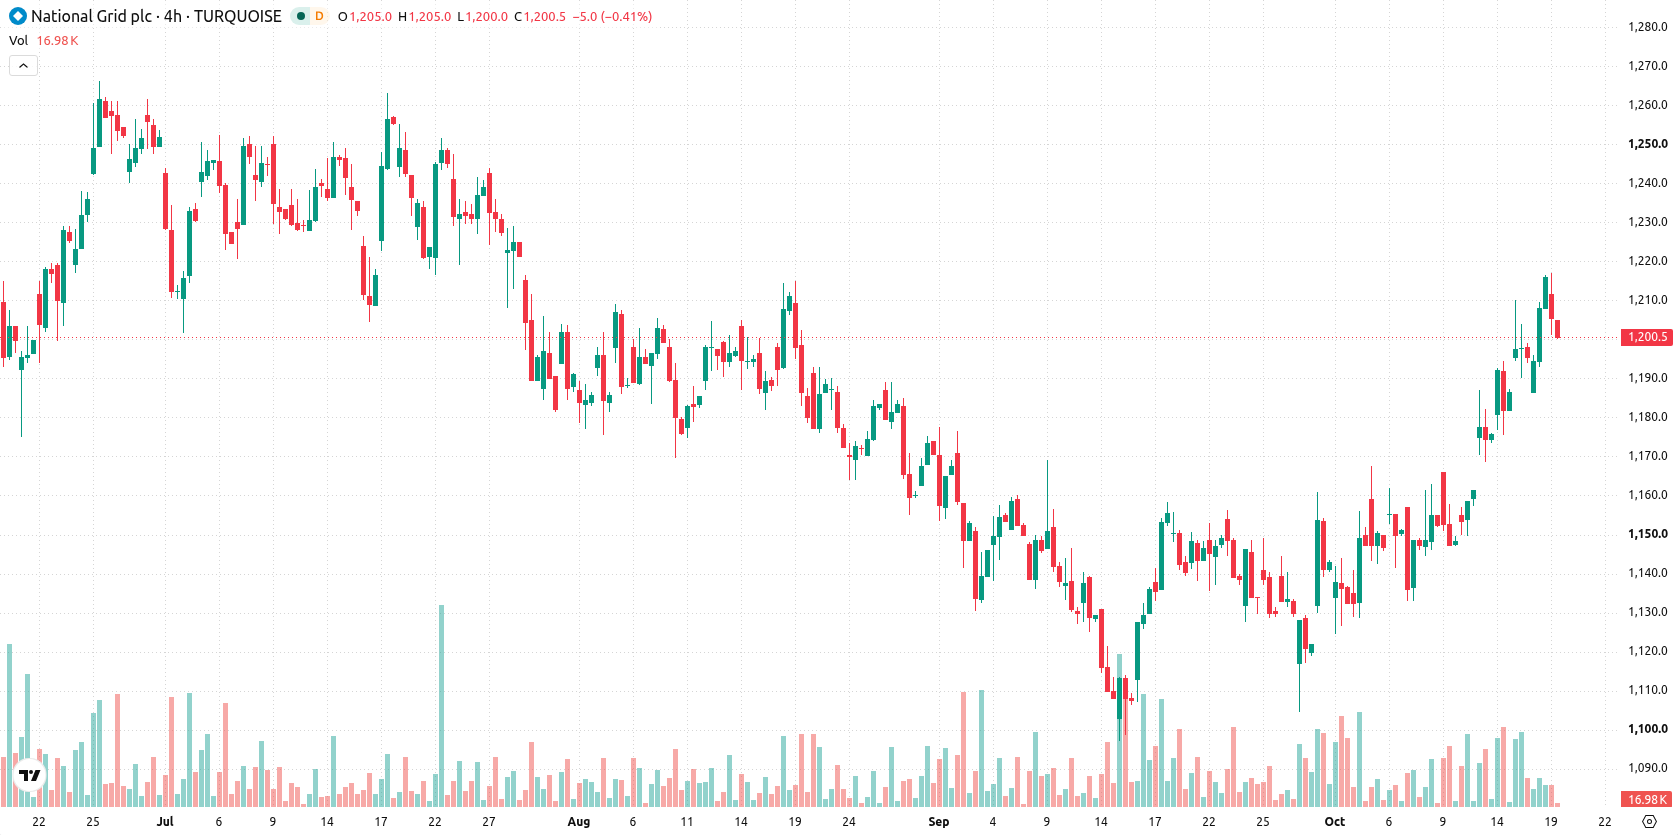
National Grid plc (NG) fell 1.58% as near-term selling pressure took hold despite technical signals favoring bullish momentum. The move contradicts the prevailing short- and medium-term upside structure, with National Grid trading above its 20-day and 50-day moving averages but struggling below longer-term resistance.
 1263.00
Highlights
- Shares of National Grid are trading between the near-term ceiling at GBX1,200 and support at GBX1,172 after opening with a downside gap.
- Technical indicators are strongly overbought, with intraday selling pressure apparent as the stock is down 1.58% at GBX1,196.
- The expected five-day price range is GBX1,172 to GBX1,220, with a 78% probability assigned to an upward move and continued sideways consolidation as the baseline scenario.
Bullish momentum faces overbought signals and weak trend strength
National Grid is trading above its 20-day and 50-day moving averages (GBX1,152 and GBX1,159), but remains below the 200-day moving average at GBX1,235. This configuration supports a bullish short- to medium-term outlook, while the longer-term trend remains bearish. The near-term ceiling is set at GBX1,200, with a floor at GBX1,172. Momentum readings are mixed: MACD is positive and on buy, and the Awesome Oscillator supports a bullish tone. However, the RSI is elevated at 71.69, the Stochastic RSI is fully overbought at 100, and the Commodity Channel Index reads 222.5, all of which flag sharply overbought conditions. The Bull/Bear Power of 47.36 also indicates intraday buying dominance and overbought pressure, while the ADX at 18.4 reflects only modest trend strength. Despite bullish momentum, today’s action is marked by a downside gap and selling after the open, keeping prices near session lows and reflecting short-term weakness within a volatile session.
Earlier, analysts noted that National Grid was exhibiting stable technical support alongside signs of overbought momentum, suggesting a period of consolidation. The latest session adds a short-term downside risk, making GBX1,172 a key level to watch for potential breakdowns in the coming days.









-
 Afghanistan
-
 Albania
-
 Algeria
-
 Angola
-
 Argentina
-
 Armenia
-
 Australia
-
 Austria
-
 Azerbaijan
-
 Bahamas
-
 Bahrain
-
 Bangladesh
-
 Belarus
-
 Belgium
-
 Bolivia
-
 Botswana
-
 Brazil
-
 Brunei
-
 Bulgaria
-
 Cambodia
-
 Cameroon
-
 Canada
-
 Chile
-
 China
-
 Colombia
-
 Congo
-
 Costa Rica
-
 Cote d'Ivoire
-
 Croatia
-
 Cuba
-
 Cyprus
-
 Czechia
-
 DR Congo
-
 Denmark
-
 Dominican Republic
-
 Ecuador
-
 Egypt
-
 El Salvador
-
 Estonia
-
 Eswatini
-
 Ethiopia
-
 Finland
-
 France
-
 Georgia
-
 Germany
-
 Ghana
-
 Greece
-
 Haiti
-
 Hong Kong
-
 Hungary
-
 India
-
 Indonesia
-
 Iran, Islamic republic
-
 Iraq
-
 Ireland
-
 Israel
-
 Italy
-
 Jamaica
-
 Japan
-
 Jordan
-
 Kazakhstan
-
 Kenya
-
 Korea
-
 Kuwait
-
 Kyrgyzstan
-
 Laos
-
 Latvia
-
 Lebanon
-
 Lesotho
-
 Libya
-
 Lithuania
-
 Luxembourg
-
 Madagascar
-
 Malaysia
-
 Malta
-
 Mauritius
-
 Mexico
-
 Moldova
-
 Mongolia
-
 Montenegro
-
 Morocco
-
 Mozambique
-
 Myanmar
-
 Namibia
-
 Nepal
-
 Netherlands
-
 New Zealand
-
 Nigeria
-
 North Macedonia
-
 Norway
-
 Oman
-
 Pakistan
-
 Palestine
-
 Panama
-
 Papua New Guinea
-
 Paraguay
-
 Peru
-
 Philippines
-
 Poland
-
 Portugal
-
 Puerto Rico
-
 Qatar
-
 Reunion
-
 Romania
-
 Rwanda
-
 Saudi Arabia
-
 Serbia
-
 Singapore
-
 Slovakia
-
 Slovenia
-
 Somalia
-
 South Africa
-
 Spain
-
 Sri Lanka
-
 Sweden
-
 Switzerland
-
 Syria
-
 Taiwan
-
 Tajikistan
-
 Tanzania
-
 Thailand
-
 Trinidad and Tobago
-
 Tunisia
-
 Turkey
-
 UAE
-
 Uganda
-
 Ukraine
-
 United Kingdom
-
United States
-
 Uruguay
-
 Uzbekistan
-
 Venezuela
-
 Vietnam
-
 Yemen
-
 Zambia
-
 Zimbabwe
- Forex
- Crypto












