

Hut 8 stock forecast: Sellers dominate with resistance at $76.28

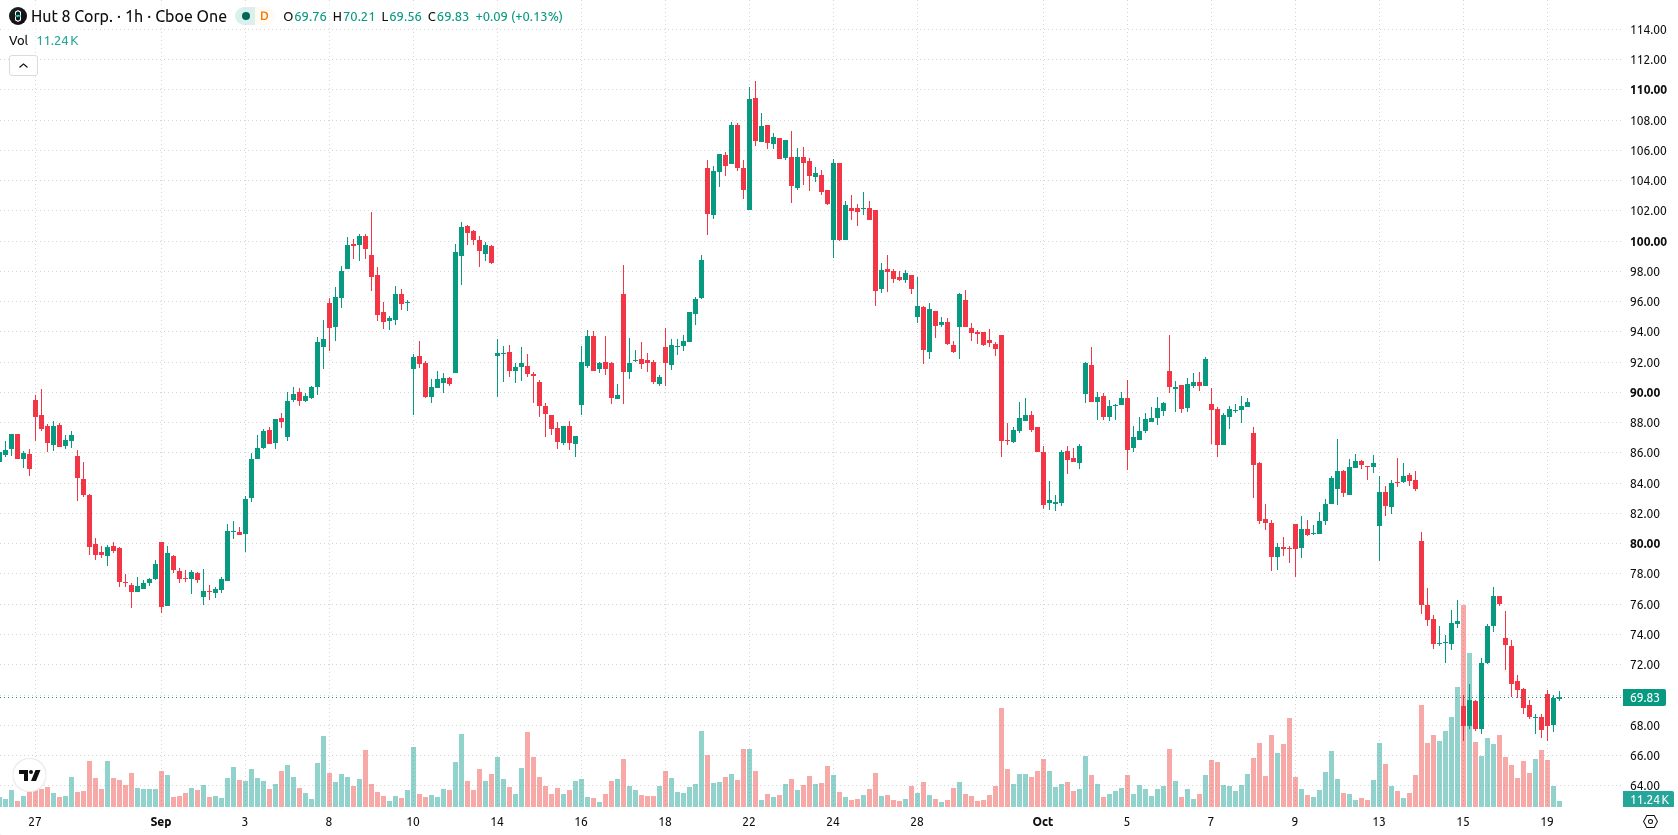
Hut 8 (HUT) stock is trading at $69.79, gaining 3% on the day. The price remains positioned below its key moving averages, reflecting sustained pressure from sellers across multiple timeframes.
 62.16
69.89
Highlights
- Hut 8 stock trades below short-, medium-, and long-term moving averages, indicating sustained seller dominance across timeframes.
- Technical indicators including MACD, ADX, and RSI confirm a prevailing bearish trend with momentum signals showing significant downside risk.
- Over the coming sessions, Hut 8 stock is projected to fluctuate between $61.49 to $78.09, with the probability of a further decline remaining very high.
Momentum weakens further amid clustered technical resistance
The MA-20, MA-50, and MA-200 now form resistance at $71.91, $78.41, and $82.06 respectively, with the Ichimoku Kijun at $76.28 providing an additional resistance layer. Indicators are broadly negative: MACD and ADX both indicate a selling environment, RSI registers 33.15 (Sell), CCI remains oversold, and Bull/Bear Power highlights seller dominance. Stoch RSI signals neutrality, while the Awesome Oscillator confirms prevailing weakness.
Volatility expected to persist as downside risk outweighs rebound
Looking ahead over the next few sessions, price action is likely to remain volatile within a $61.49–$78.09 band. The probability of further downside is high, with upside scenarios less likely unless HUT breaks decisively above the Kijun and resistance near $76.28. Should the price fall below $61.49, this would confirm deeper bearish momentum, while any sideways persistence suggests continued choppy trading according to typical volatility bands.
Earlier, analysts noted that Hut 8 was exhibiting persistent technical weakness with an elevated risk of continued downside. The latest trading action and indicator readings reinforce this view, highlighting $61.49 as a critical support to monitor for potential renewed selling pressure in the near term.











-
 Afghanistan
-
 Albania
-
 Algeria
-
 Angola
-
 Argentina
-
 Armenia
-
 Australia
-
 Austria
-
 Azerbaijan
-
 Bahamas
-
 Bahrain
-
 Bangladesh
-
 Belarus
-
 Belgium
-
 Bolivia
-
 Botswana
-
 Brazil
-
 Brunei
-
 Bulgaria
-
 Cambodia
-
 Cameroon
-
 Canada
-
 Chile
-
 China
-
 Colombia
-
 Congo
-
 Costa Rica
-
 Cote d'Ivoire
-
 Croatia
-
 Cuba
-
 Cyprus
-
 Czechia
-
 DR Congo
-
 Denmark
-
 Dominican Republic
-
 Ecuador
-
 Egypt
-
 El Salvador
-
 Estonia
-
 Eswatini
-
 Ethiopia
-
 Finland
-
 France
-
 Georgia
-
 Germany
-
 Ghana
-
 Greece
-
 Haiti
-
 Hong Kong
-
 Hungary
-
 India
-
 Indonesia
-
 Iran, Islamic republic
-
 Iraq
-
 Ireland
-
 Israel
-
 Italy
-
 Jamaica
-
 Japan
-
 Jordan
-
 Kazakhstan
-
 Kenya
-
 Korea
-
 Kuwait
-
 Kyrgyzstan
-
 Laos
-
 Latvia
-
 Lebanon
-
 Lesotho
-
 Libya
-
 Lithuania
-
 Luxembourg
-
 Madagascar
-
 Malaysia
-
 Malta
-
 Mauritius
-
 Mexico
-
 Moldova
-
 Mongolia
-
 Montenegro
-
 Morocco
-
 Mozambique
-
 Myanmar
-
 Namibia
-
 Nepal
-
 Netherlands
-
 New Zealand
-
 Nigeria
-
 North Macedonia
-
 Norway
-
 Oman
-
 Pakistan
-
 Palestine
-
 Panama
-
 Papua New Guinea
-
 Paraguay
-
 Peru
-
 Philippines
-
 Poland
-
 Portugal
-
 Puerto Rico
-
 Qatar
-
 Reunion
-
 Romania
-
 Rwanda
-
 Saudi Arabia
-
 Serbia
-
 Singapore
-
 Slovakia
-
 Slovenia
-
 Somalia
-
 South Africa
-
 Spain
-
 Sri Lanka
-
 Sweden
-
 Switzerland
-
 Syria
-
 Taiwan
-
 Tajikistan
-
 Tanzania
-
 Thailand
-
 Trinidad and Tobago
-
 Tunisia
-
 Turkey
-
 UAE
-
 Uganda
-
 Ukraine
-
 United Kingdom
-
United States
-
 Uruguay
-
 Uzbekistan
-
 Venezuela
-
 Vietnam
-
 Yemen
-
 Zambia
-
 Zimbabwe
- Forex
- Crypto












