

HUT climbs around 4.5% after buyers dominate the day despite mixed momentum signals

Hut 8 Corp (HUT) rallied 4.43% today, driven by strong intraday buying and a close near the session high after an initial downside gap. The rebound looks limited, with the stock remaining below both its 50- and 200-day moving averages, signaling that longer-term seller pressure still dominates.
 61.83
61.03
Highlights
- Hut 8 stock is trading above short-term support but below medium- and long-term trend levels, indicating ongoing seller pressure.
- Technical momentum signals remain mixed with a neutral oscillator backdrop and overbought risk, while intraday action favors buyers.
- Expected five-day price range is $54.65 to $64.75, with a 70% probability of a downward move and key resistance at $61.03.
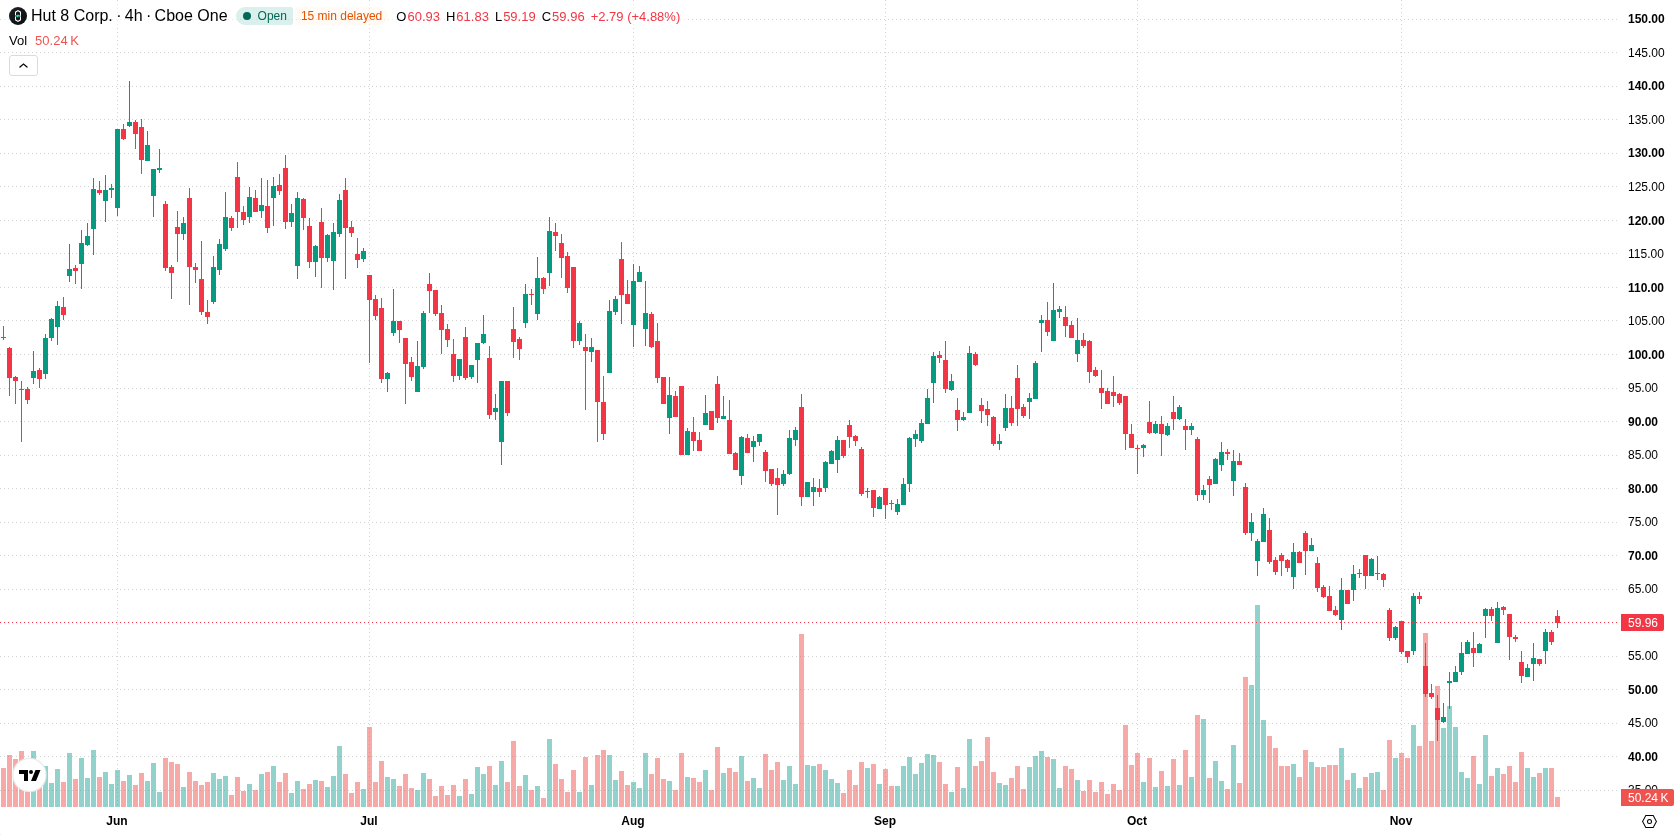
Short-term support outweighed by bearish momentum under resistance
Hut 8 is trading above its 20-day moving average ($58.76) but remains below the 50-day ($76.24) and 200-day ($82.31) moving averages, suggesting short-term support while medium- and long-term trends remain bearish. Key resistance is at the weekly high of $61.03, with intraday support at the current session high of $59. The Ichimoku Kijun at $61.24 functions as additional resistance and underlines ongoing overhead pressure. Momentum signals present a mixed picture: both the Moving Average Convergence Divergence (MACD) and the Average Directional Index (ADX) indicate ongoing bearish momentum, while the Relative Strength Index (RSI), Commodity Channel Index (CCI), and Awesome Oscillator remain neutral. The Stochastic RSI has entered the overbought zone, highlighting a possible risk of near-term downside correction, though there is no confirmation of a reversal. Bull/Bear Power (BBP) is positive, reflecting buyers' dominance of the intraday action. The strong finish toward the session high reinforces a buyer-led tone for the day, despite mixed momentum and neutral readings across most oscillators aside from the overbought Stochastic RSI.
Previously it was reported that Hut 8 faced dominant bearish momentum and volatility, with upside potential constrained by persistent technical resistance. The current analysis confirms this cautious outlook, as ongoing bearish signals and resistance below key moving averages point to a sideways trading range and heightened sensitivity to moves above $61.03 or below $59 in the coming sessions.











-
 Afghanistan
-
 Albania
-
 Algeria
-
 Angola
-
 Argentina
-
 Armenia
-
 Australia
-
 Austria
-
 Azerbaijan
-
 Bahamas
-
 Bahrain
-
 Bangladesh
-
 Belarus
-
 Belgium
-
 Bolivia
-
 Botswana
-
 Brazil
-
 Brunei
-
 Bulgaria
-
 Cambodia
-
 Cameroon
-
 Canada
-
 Chile
-
 China
-
 Colombia
-
 Congo
-
 Costa Rica
-
 Cote d'Ivoire
-
 Croatia
-
 Cuba
-
 Cyprus
-
 Czechia
-
 DR Congo
-
 Denmark
-
 Dominican Republic
-
 Ecuador
-
 Egypt
-
 El Salvador
-
 Estonia
-
 Eswatini
-
 Ethiopia
-
 Finland
-
 France
-
 Georgia
-
 Germany
-
 Ghana
-
 Greece
-
 Haiti
-
 Hong Kong
-
 Hungary
-
 India
-
 Indonesia
-
 Iran, Islamic republic
-
 Iraq
-
 Ireland
-
 Israel
-
 Italy
-
 Jamaica
-
 Japan
-
 Jordan
-
 Kazakhstan
-
 Kenya
-
 Korea
-
 Kuwait
-
 Kyrgyzstan
-
 Laos
-
 Latvia
-
 Lebanon
-
 Lesotho
-
 Libya
-
 Lithuania
-
 Luxembourg
-
 Madagascar
-
 Malaysia
-
 Malta
-
 Mauritius
-
 Mexico
-
 Moldova
-
 Mongolia
-
 Montenegro
-
 Morocco
-
 Mozambique
-
 Myanmar
-
 Namibia
-
 Nepal
-
 Netherlands
-
 New Zealand
-
 Nigeria
-
 North Macedonia
-
 Norway
-
 Oman
-
 Pakistan
-
 Palestine
-
 Panama
-
 Papua New Guinea
-
 Paraguay
-
 Peru
-
 Philippines
-
 Poland
-
 Portugal
-
 Puerto Rico
-
 Qatar
-
 Reunion
-
 Romania
-
 Rwanda
-
 Saudi Arabia
-
 Serbia
-
 Singapore
-
 Slovakia
-
 Slovenia
-
 Somalia
-
 South Africa
-
 Spain
-
 Sri Lanka
-
 Sweden
-
 Switzerland
-
 Syria
-
 Taiwan
-
 Tajikistan
-
 Tanzania
-
 Thailand
-
 Trinidad and Tobago
-
 Tunisia
-
 Turkey
-
 UAE
-
 Uganda
-
 Ukraine
-
 United Kingdom
-
United States
-
 Uruguay
-
 Uzbekistan
-
 Venezuela
-
 Vietnam
-
 Yemen
-
 Zambia
-
 Zimbabwe
- Forex
- Crypto












