

National Grid stock holds near GBX1,201 resistance amid consolidation near a key level

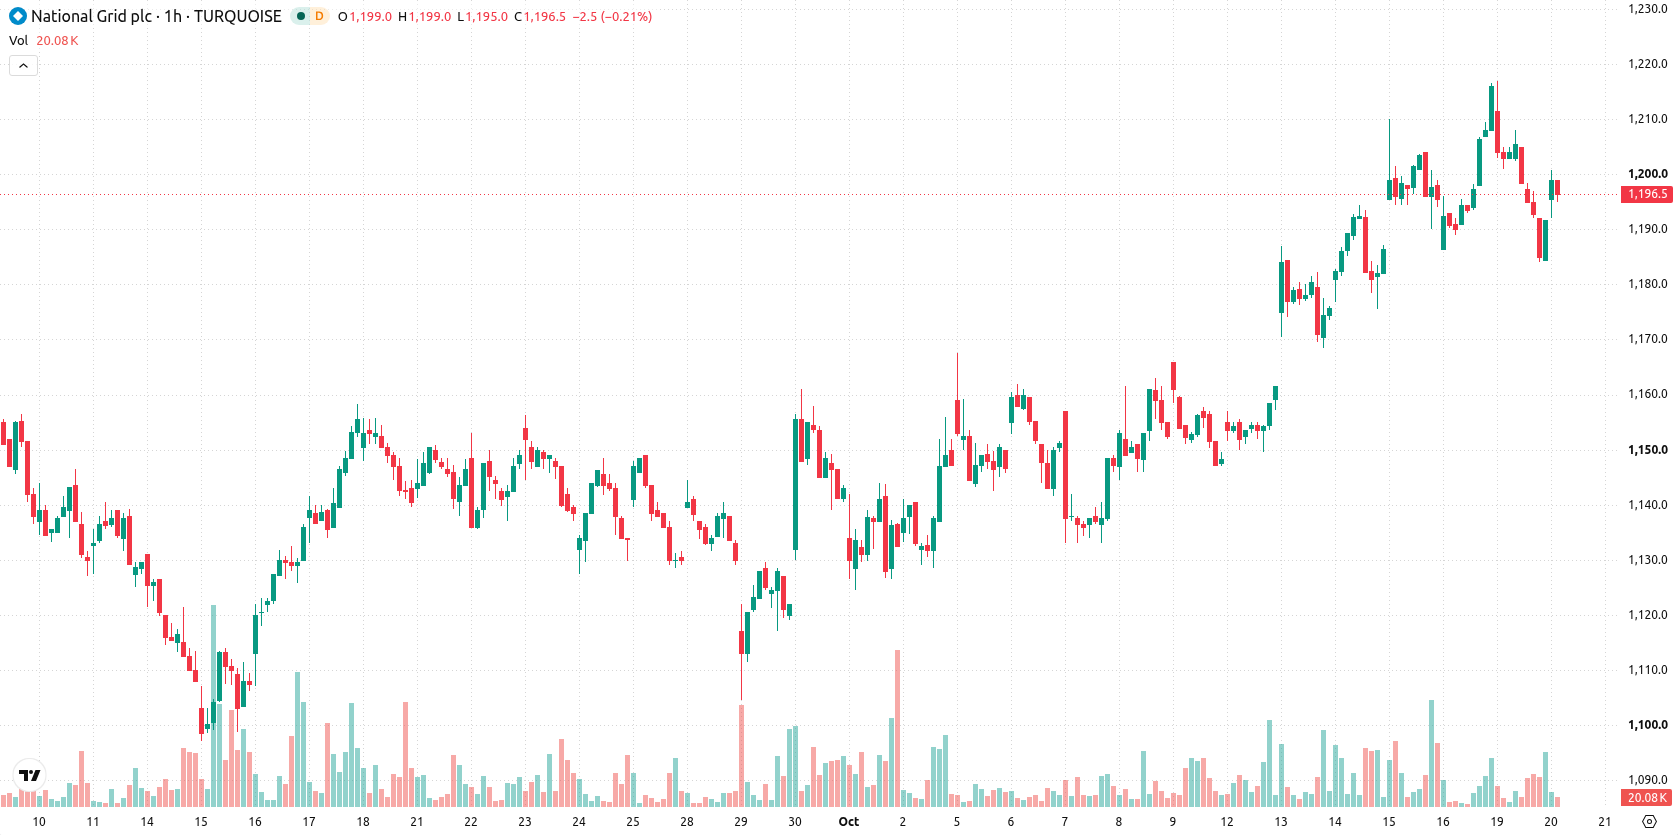
National Grid (NG) stock is trading at GBX1,198, with a modest gain for the session and holding near today's high. The price is positioned above its key short- and medium-term moving averages, highlighting recent support in an otherwise low-volatility market environment.
 1261.50
1262.50
Highlights
- Price remains below long-term trend levels, indicating continued bearish pressure over the broader timeframe.
- Momentum indicators show buyers currently controlling with a mild bullish bias, although mixed signals from oscillators create some divergence.
- Expected price range over the next 2 to 3 sessions is GBX1,178 to GBX1,217, with a high likelihood of upward movement unless support breaks.
Momentum divergence as buy signals meet long-term resistance
The MA-20 and MA-50 have both been crossed to the upside, but the price remains capped by the MA-200, which signals ongoing long-term pressure. The Ichimoku Kijun is at GBX1,201 and acts as immediate resistance. MACD and ADX currently indicate strong momentum on the buy side, while both Stochastic RSI and CCI are neutral and RSI sits at 51.7 with a mild bullish bias. Bull/Bear Power currently reflects buyers in control; however, this is offset by neutral readings from other oscillators, suggesting some divergence as the session closes near the high.
Rangebound consolidation likely as breakouts await volatility
Over the next two to three sessions, NG is expected to trade within a GBX1,178–GBX1,217 corridor, representing a typical volatility band relative to current levels. The baseline scenario is for price to consolidate in this range. A decisive move above GBX1,201 would open the way for a bullish extension, while a drop below GBX1,178 could trigger short-term downside momentum.
Earlier, analysts noted that National Grid was exhibiting short- to medium-term bullish momentum but faced ongoing long-term resistance and overbought conditions. The current technical setup suggests price consolidation remains likely, but traders should monitor for a potential breakout above GBX1,201 or a reversal below GBX1,178 as cues for the next directional move.









-
 Afghanistan
-
 Albania
-
 Algeria
-
 Angola
-
 Argentina
-
 Armenia
-
 Australia
-
 Austria
-
 Azerbaijan
-
 Bahamas
-
 Bahrain
-
 Bangladesh
-
 Belarus
-
 Belgium
-
 Bolivia
-
 Botswana
-
 Brazil
-
 Brunei
-
 Bulgaria
-
 Cambodia
-
 Cameroon
-
 Canada
-
 Chile
-
 China
-
 Colombia
-
 Congo
-
 Costa Rica
-
 Cote d'Ivoire
-
 Croatia
-
 Cuba
-
 Cyprus
-
 Czechia
-
 DR Congo
-
 Denmark
-
 Dominican Republic
-
 Ecuador
-
 Egypt
-
 El Salvador
-
 Estonia
-
 Eswatini
-
 Ethiopia
-
 Finland
-
 France
-
 Georgia
-
 Germany
-
 Ghana
-
 Greece
-
 Haiti
-
 Hong Kong
-
 Hungary
-
 India
-
 Indonesia
-
 Iran, Islamic republic
-
 Iraq
-
 Ireland
-
 Israel
-
 Italy
-
 Jamaica
-
 Japan
-
 Jordan
-
 Kazakhstan
-
 Kenya
-
 Korea
-
 Kuwait
-
 Kyrgyzstan
-
 Laos
-
 Latvia
-
 Lebanon
-
 Lesotho
-
 Libya
-
 Lithuania
-
 Luxembourg
-
 Madagascar
-
 Malaysia
-
 Malta
-
 Mauritius
-
 Mexico
-
 Moldova
-
 Mongolia
-
 Montenegro
-
 Morocco
-
 Mozambique
-
 Myanmar
-
 Namibia
-
 Nepal
-
 Netherlands
-
 New Zealand
-
 Nigeria
-
 North Macedonia
-
 Norway
-
 Oman
-
 Pakistan
-
 Palestine
-
 Panama
-
 Papua New Guinea
-
 Paraguay
-
 Peru
-
 Philippines
-
 Poland
-
 Portugal
-
 Puerto Rico
-
 Qatar
-
 Reunion
-
 Romania
-
 Rwanda
-
 Saudi Arabia
-
 Serbia
-
 Singapore
-
 Slovakia
-
 Slovenia
-
 Somalia
-
 South Africa
-
 Spain
-
 Sri Lanka
-
 Sweden
-
 Switzerland
-
 Syria
-
 Taiwan
-
 Tajikistan
-
 Tanzania
-
 Thailand
-
 Trinidad and Tobago
-
 Tunisia
-
 Turkey
-
 UAE
-
 Uganda
-
 Ukraine
-
 United Kingdom
-
United States
-
 Uruguay
-
 Uzbekistan
-
 Venezuela
-
 Vietnam
-
 Yemen
-
 Zambia
-
 Zimbabwe
- Forex
- Crypto












