

Tesla stock weekly forecast: Consolidates between Ichimoku support and 20-day resistance

Shares of Tesla, Inc. (TSLA) are trading near $368 after rising around 4% over the past week. Corporate updates, including the upcoming earnings announcement and recent product demonstrations, are keeping the stock within a holding pattern. Traders are looking to see if the tight range continues as the new week brings earnings and renewed attention on demand factors.
 403.82
408.36
Highlights
- Shares of Tesla rose 3.66% over seven days to $367.8, trading above the 50-day average but below the 20-day and 200-day averages.
- The stock is consolidating near resistance at $369.89 and support at $367.04, with volatility at 7.89% and mixed momentum signals.
- Tesla stock is expected to trade between $355.47 and $380.12 over the next five days, with a 57% probability of an increase.
Earnings expectations shift as merger talk and China policy boost sentiment
Tesla is set to report its third-quarter earnings on October 21, with CNBC noting that both revenue and earnings per share are expected to decline from last year. Investors are watching for official commentary regarding ongoing merger speculation with SpaceX and management’s guidance on capital expenditures and AI investment, according to Tech Insider. Other recent developments include third-quarter vehicle deliveries topping market forecasts, a next-generation Roadster demo featuring SpaceX thruster technology that drove derivatives trading according to Crowdfund Insider, and support from China’s new tech subsidy program as reported by Yahoo Finance (source: TradingKey).
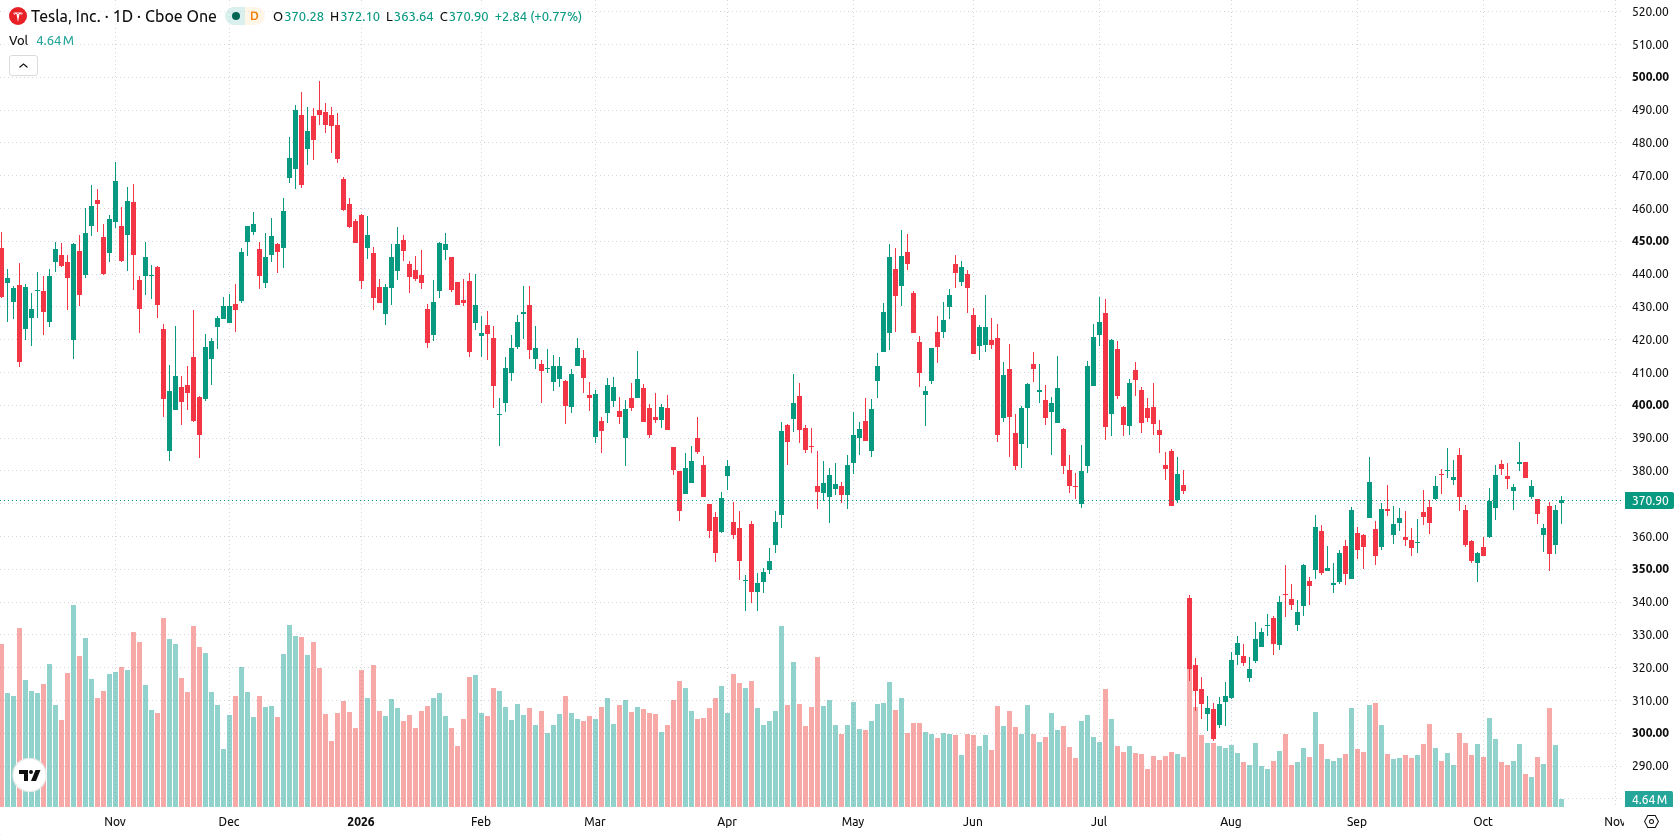
Consolidation persists as technical signals diverge and buyers edge in
On the daily chart, the stock is consolidating between key levels, with volatility over the past week at 7.89% and momentum characterized as a contained move within a narrow range. The MACD shows a strong buy at 0.79, while Bull/Bear Power is signaling overbought conditions, highlighting a divergence in momentum signals. The nearest support is the Ichimoku Kijun at $367.04, with resistance at the 20-day moving average at $369.89. This setup points to ongoing consolidation, but with buying interest emerging above the 50-day average.
Consolidation bias prevails next week as range breakout risk increases
Over the next five trading days, Tesla is expected to fluctuate within a range of $355.47 to $380.12. The probability of an increase stands at 57%, with a 43% chance of a decline. The base case is continued consolidation between $367.04 and $369.89. A move above $369.89 could target the upper end of the range, while a break below $367.04 would expose the lower bound near $355.47.
Earlier, analysts noted that Tesla’s handling of the Swedish labor dispute signified the company’s ability to navigate challenges without altering its stance on union agreements. The current technical setup indicates that traders should watch for a potential breakout above resistance at $369.89 or a breakdown below support at $367.04 as the upcoming earnings report introduces fresh catalysts and possible shifts in the prevailing consolidation range.











-
 Afghanistan
-
 Albania
-
 Algeria
-
 Angola
-
 Argentina
-
 Armenia
-
 Australia
-
 Austria
-
 Azerbaijan
-
 Bahamas
-
 Bahrain
-
 Bangladesh
-
 Belarus
-
 Belgium
-
 Bolivia
-
 Botswana
-
 Brazil
-
 Brunei
-
 Bulgaria
-
 Cambodia
-
 Cameroon
-
 Canada
-
 Chile
-
 China
-
 Colombia
-
 Congo
-
 Costa Rica
-
 Cote d'Ivoire
-
 Croatia
-
 Cuba
-
 Cyprus
-
 Czechia
-
 DR Congo
-
 Denmark
-
 Dominican Republic
-
 Ecuador
-
 Egypt
-
 El Salvador
-
 Estonia
-
 Eswatini
-
 Ethiopia
-
 Finland
-
 France
-
 Georgia
-
 Germany
-
 Ghana
-
 Greece
-
 Haiti
-
 Hong Kong
-
 Hungary
-
 India
-
 Indonesia
-
 Iran, Islamic republic
-
 Iraq
-
 Ireland
-
 Israel
-
 Italy
-
 Jamaica
-
 Japan
-
 Jordan
-
 Kazakhstan
-
 Kenya
-
 Korea
-
 Kuwait
-
 Kyrgyzstan
-
 Laos
-
 Latvia
-
 Lebanon
-
 Lesotho
-
 Libya
-
 Lithuania
-
 Luxembourg
-
 Madagascar
-
 Malaysia
-
 Malta
-
 Mauritius
-
 Mexico
-
 Moldova
-
 Mongolia
-
 Montenegro
-
 Morocco
-
 Mozambique
-
 Myanmar
-
 Namibia
-
 Nepal
-
 Netherlands
-
 New Zealand
-
 Nigeria
-
 North Macedonia
-
 Norway
-
 Oman
-
 Pakistan
-
 Palestine
-
 Panama
-
 Papua New Guinea
-
 Paraguay
-
 Peru
-
 Philippines
-
 Poland
-
 Portugal
-
 Puerto Rico
-
 Qatar
-
 Reunion
-
 Romania
-
 Rwanda
-
 Saudi Arabia
-
 Serbia
-
 Singapore
-
 Slovakia
-
 Slovenia
-
 Somalia
-
 South Africa
-
 Spain
-
 Sri Lanka
-
 Sweden
-
 Switzerland
-
 Syria
-
 Taiwan
-
 Tajikistan
-
 Tanzania
-
 Thailand
-
 Trinidad and Tobago
-
 Tunisia
-
 Turkey
-
 UAE
-
 Uganda
-
 Ukraine
-
 United Kingdom
-
United States
-
 Uruguay
-
 Uzbekistan
-
 Venezuela
-
 Vietnam
-
 Yemen
-
 Zambia
-
 Zimbabwe
- Forex
- Crypto












