

General Motors narrows 2026 profit guidance: Can GM avoid deeper losses?

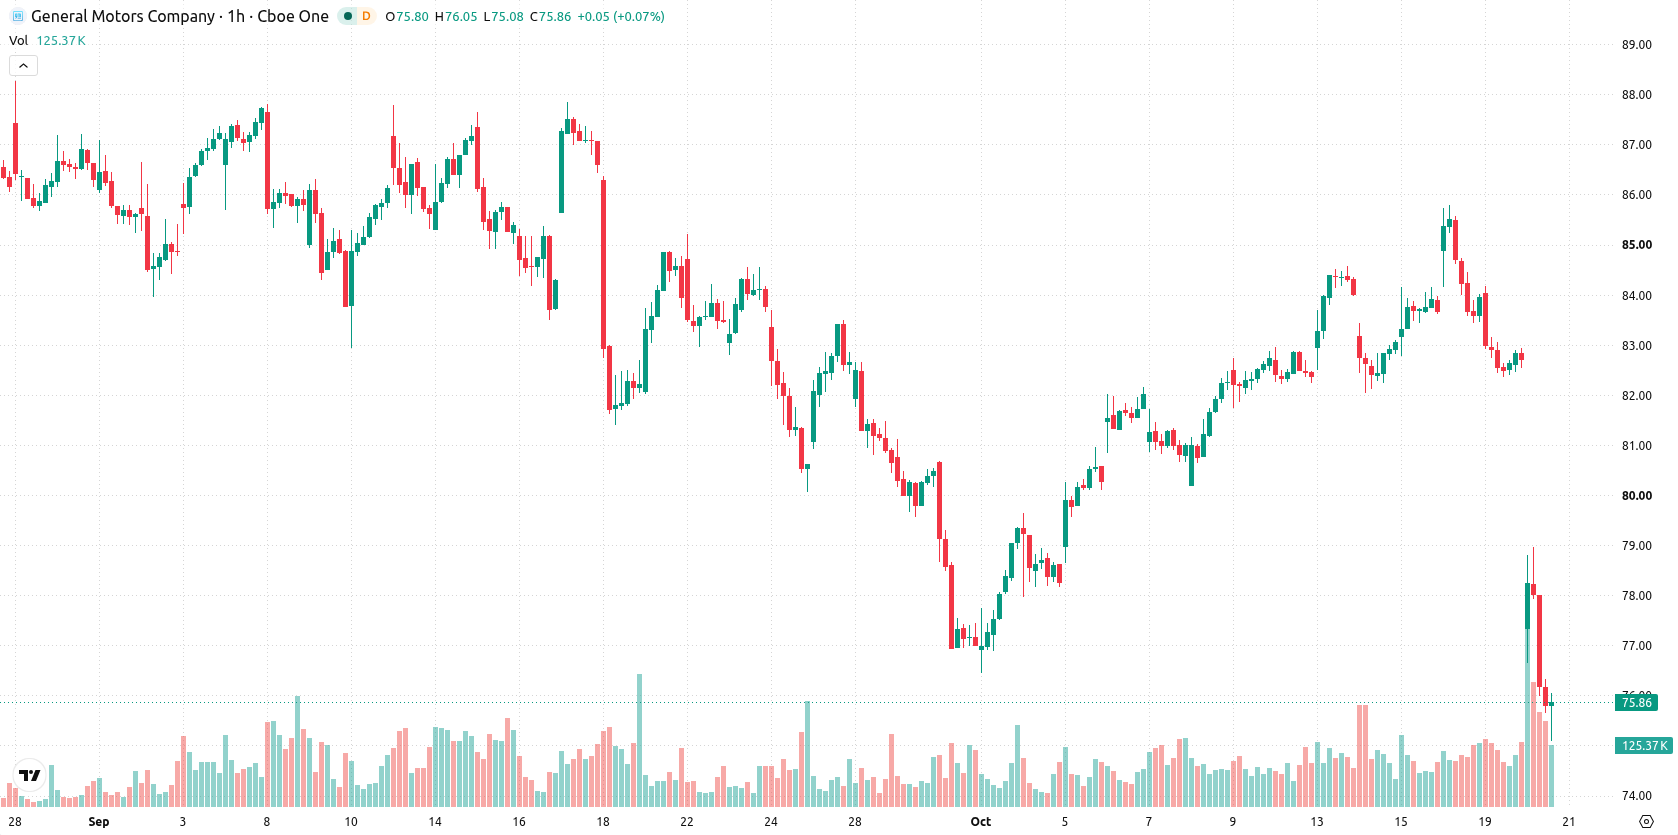
General Motors (GM) stock is trading at $75.75, down 8.28% from the previous close. The share price sits well below its key moving averages, suggesting recent seller dominance.
 87.98
87.98
Highlights
- General Motors reported third-quarter 2026 revenue of $50 billion with net income attributable to stockholders of $3.3 billion.
- The company narrowed its full-year adjusted operating profit outlook to $14.5 billion to $15.5 billion and approved a new $20 billion share repurchase plan.
- Shares of General Motors trade well below key moving averages with sustained selling pressure, and the expected price range in the next few days is $74.08 to $77.42 as downside momentum continues.
Profit guidance cut and buyback approval as management pushes caution
General Motors reported third-quarter 2026 revenue of $50.0 billion and net income attributable to stockholders of $3.3 billion, providing investors with a clear update on recent operating performance. The company also narrowed its full-year adjusted operating profit guidance to $14.5 billion to $15.5 billion, consolidating expectations and signaling increased management caution that may weigh on sentiment. The Board of Directors approved a new $20 billion multiyear share repurchase authorization, while a quarterly cash dividend of $0.18 per share payable December 17, 2026, was declared according to PR Newswire. These initiatives introduce long-term capital return but have occurred in a period of broad selling pressure.
Technical weakness builds as indicators confirm oversold and resistance
GM is trading below the MA-20 at $83.63, the MA-50 at $83.20, and the MA-200 at $80.69, with the Ichimoku Kijun level at $83.95 now acting as immediate resistance. Momentum indicators continue to signal weakness: MACD remains on Sell, ADX is Neutral, and RSI reads 41.9, marking the stock in Sell territory. Additionally, Stoch RSI, CCI, and Bull/Bear Power all show oversold conditions, and the Awesome Oscillator confirms ongoing seller dominance. The gap down on the open and a close near intraday lows reinforce persistent negative momentum with no distinct bullish divergence.
Bearish outlook prevails as breakout odds remain low
Over the coming two to three trading days, GM is expected to fluctuate between $74.08 and $77.42, representing the typical volatility band relative to current levels. The probability of an upward breakout remains very low, while the odds strongly favor continued downside. Baseline expectations suggest a sideways pattern within this range as market participants balance out. Should GM break above $83.95, a near-term reversal could materialize; a drop below $74.08 would signal further downside risk and validate the prevailing bearish trajectory.
Earlier, analysts noted that General Motors shares were consolidating in a narrow range, with breakout risks shaping a neutral-to-cautious short-term outlook. The current technical deterioration confirms a shift toward increased downside momentum, making a sustained close below $74.08 a critical risk marker for further weakness.









-
 Afghanistan
-
 Albania
-
 Algeria
-
 Angola
-
 Argentina
-
 Armenia
-
 Australia
-
 Austria
-
 Azerbaijan
-
 Bahamas
-
 Bahrain
-
 Bangladesh
-
 Belarus
-
 Belgium
-
 Bolivia
-
 Botswana
-
 Brazil
-
 Brunei
-
 Bulgaria
-
 Cambodia
-
 Cameroon
-
 Canada
-
 Chile
-
 China
-
 Colombia
-
 Congo
-
 Costa Rica
-
 Cote d'Ivoire
-
 Croatia
-
 Cuba
-
 Cyprus
-
 Czechia
-
 DR Congo
-
 Denmark
-
 Dominican Republic
-
 Ecuador
-
 Egypt
-
 El Salvador
-
 Estonia
-
 Eswatini
-
 Ethiopia
-
 Finland
-
 France
-
 Georgia
-
 Germany
-
 Ghana
-
 Greece
-
 Haiti
-
 Hong Kong
-
 Hungary
-
 India
-
 Indonesia
-
 Iran, Islamic republic
-
 Iraq
-
 Ireland
-
 Israel
-
 Italy
-
 Jamaica
-
 Japan
-
 Jordan
-
 Kazakhstan
-
 Kenya
-
 Korea
-
 Kuwait
-
 Kyrgyzstan
-
 Laos
-
 Latvia
-
 Lebanon
-
 Lesotho
-
 Libya
-
 Lithuania
-
 Luxembourg
-
 Madagascar
-
 Malaysia
-
 Malta
-
 Mauritius
-
 Mexico
-
 Moldova
-
 Mongolia
-
 Montenegro
-
 Morocco
-
 Mozambique
-
 Myanmar
-
 Namibia
-
 Nepal
-
 Netherlands
-
 New Zealand
-
 Nigeria
-
 North Macedonia
-
 Norway
-
 Oman
-
 Pakistan
-
 Palestine
-
 Panama
-
 Papua New Guinea
-
 Paraguay
-
 Peru
-
 Philippines
-
 Poland
-
 Portugal
-
 Puerto Rico
-
 Qatar
-
 Reunion
-
 Romania
-
 Rwanda
-
 Saudi Arabia
-
 Serbia
-
 Singapore
-
 Slovakia
-
 Slovenia
-
 Somalia
-
 South Africa
-
 Spain
-
 Sri Lanka
-
 Sweden
-
 Switzerland
-
 Syria
-
 Taiwan
-
 Tajikistan
-
 Tanzania
-
 Thailand
-
 Trinidad and Tobago
-
 Tunisia
-
 Turkey
-
 UAE
-
 Uganda
-
 Ukraine
-
 United Kingdom
-
United States
-
 Uruguay
-
 Uzbekistan
-
 Venezuela
-
 Vietnam
-
 Yemen
-
 Zambia
-
 Zimbabwe
- Forex
- Crypto












