


Royalty Pharma plc (RPRX) surged 3.28% on strong technical momentum, as bullish indicators drove buyers into the stock. The quality of the advance is supported by its firm position above key moving averages, though overbought conditions warn that the rally may be nearing short-term limits.
 69.42
70.37
Highlights
- Shares of Royalty Pharma are in a strong uptrend, trading above key short-, medium-, and long-term moving averages.
- Multiple momentum indicators such as ADX and the Awesome Oscillator confirm significant buying strength, but oscillators warn of overbought conditions.
- Key levels are $62.4 as immediate resistance and $61.3 as support, with a 5-day forecasted range of $60.04 to $64.41.
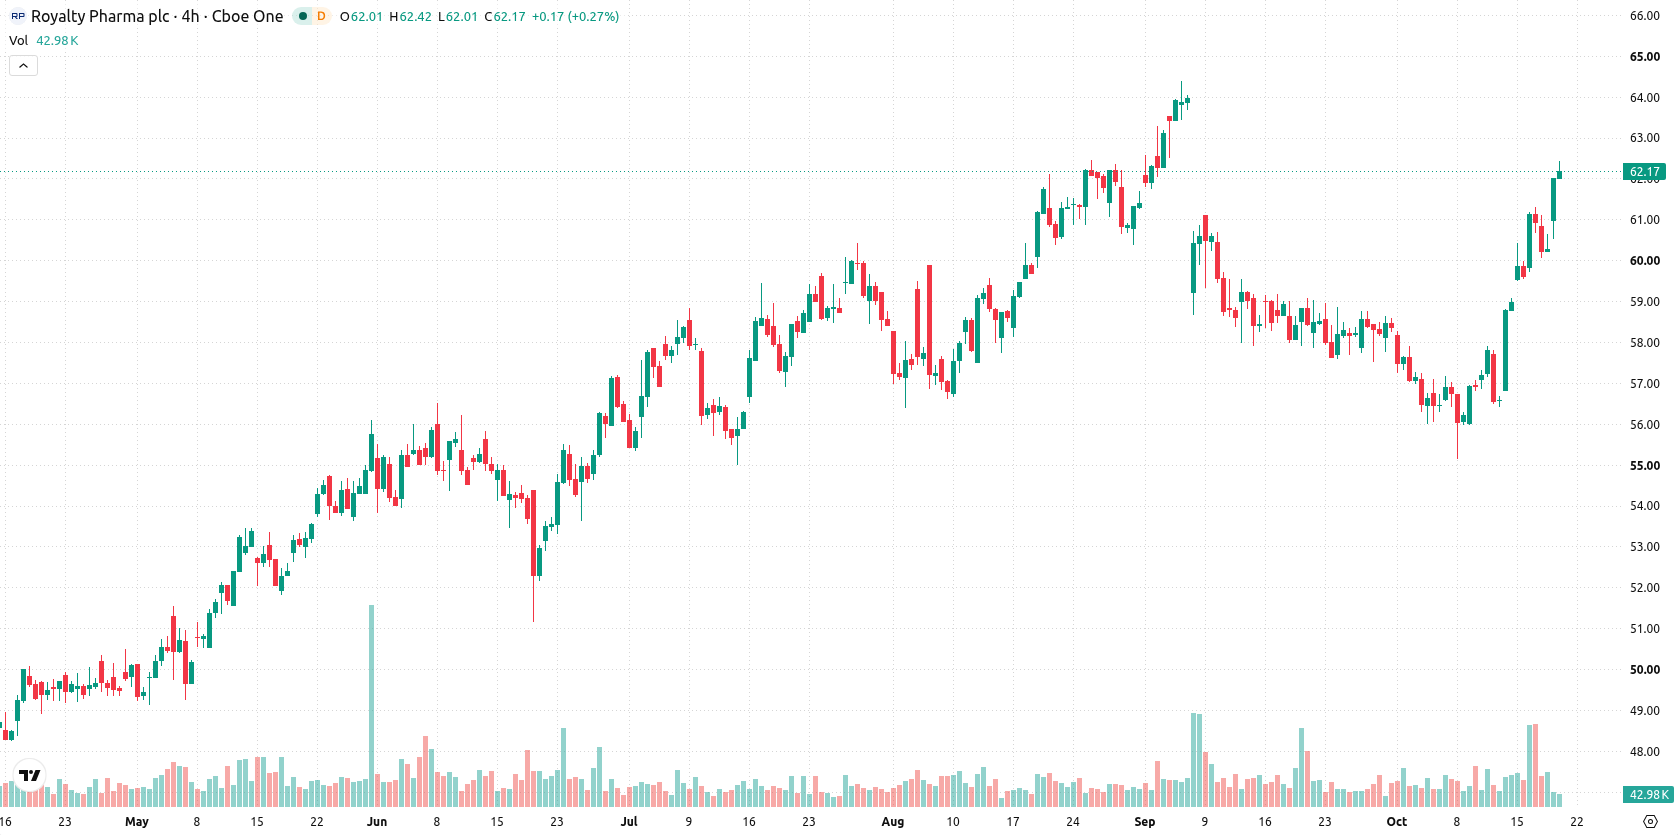
Sustained uptrend as overbought signals and volatility intensify
Royalty Pharma is trading well above its 20-day, 50-day, and 200-day moving averages ($57.98, $59.35, and $52.13), which signals strong bullish momentum across all timeframes. The prevailing uptrend is reinforced by the ADX and Awesome Oscillator both giving buy signals, although the MACD appears neutral. The RSI, CCI, and Stochastic RSI all indicate overbought territory, highlighting that buying pressure is elevated. Bull/Bear Power and intraday technicals further confirm buyers are in control, even as intraday volatility runs high at 2.38%. Near-term support is at $61.3, while resistance stands at $62.4.
Previously it was reported that Royalty Pharma's medium- and long-term bullish technical structure remained intact despite episodes of short-term selling pressure. The latest data reinforce this outlook, with the primary risk now shifting to a potential pullback if support at $61.3 is breached.






Latest Royalty Pharma News





-
 Afghanistan
-
 Albania
-
 Algeria
-
 Angola
-
 Argentina
-
 Armenia
-
 Australia
-
 Austria
-
 Azerbaijan
-
 Bahamas
-
 Bahrain
-
 Bangladesh
-
 Belarus
-
 Belgium
-
 Bolivia
-
 Botswana
-
 Brazil
-
 Brunei
-
 Bulgaria
-
 Cambodia
-
 Cameroon
-
 Canada
-
 Chile
-
 China
-
 Colombia
-
 Congo
-
 Costa Rica
-
 Cote d'Ivoire
-
 Croatia
-
 Cuba
-
 Cyprus
-
 Czechia
-
 DR Congo
-
 Denmark
-
 Dominican Republic
-
 Ecuador
-
 Egypt
-
 El Salvador
-
 Estonia
-
 Eswatini
-
 Ethiopia
-
 Finland
-
 France
-
 Georgia
-
 Germany
-
 Ghana
-
 Greece
-
 Haiti
-
 Hong Kong
-
 Hungary
-
 India
-
 Indonesia
-
 Iran, Islamic republic
-
 Iraq
-
 Ireland
-
 Israel
-
 Italy
-
 Jamaica
-
 Japan
-
 Jordan
-
 Kazakhstan
-
 Kenya
-
 Korea
-
 Kuwait
-
 Kyrgyzstan
-
 Laos
-
 Latvia
-
 Lebanon
-
 Lesotho
-
 Libya
-
 Lithuania
-
 Luxembourg
-
 Madagascar
-
 Malaysia
-
 Malta
-
 Mauritius
-
 Mexico
-
 Moldova
-
 Mongolia
-
 Montenegro
-
 Morocco
-
 Mozambique
-
 Myanmar
-
 Namibia
-
 Nepal
-
 Netherlands
-
 New Zealand
-
 Nigeria
-
 North Macedonia
-
 Norway
-
 Oman
-
 Pakistan
-
 Palestine
-
 Panama
-
 Papua New Guinea
-
 Paraguay
-
 Peru
-
 Philippines
-
 Poland
-
 Portugal
-
 Puerto Rico
-
 Qatar
-
 Reunion
-
 Romania
-
 Rwanda
-
 Saudi Arabia
-
 Serbia
-
 Singapore
-
 Slovakia
-
 Slovenia
-
 Somalia
-
 South Africa
-
 Spain
-
 Sri Lanka
-
 Sweden
-
 Switzerland
-
 Syria
-
 Taiwan
-
 Tajikistan
-
 Tanzania
-
 Thailand
-
 Trinidad and Tobago
-
 Tunisia
-
 Turkey
-
 UAE
-
 Uganda
-
 Ukraine
-
 United Kingdom
-
United States
-
 Uruguay
-
 Uzbekistan
-
 Venezuela
-
 Vietnam
-
 Yemen
-
 Zambia
-
 Zimbabwe
- Forex
- Crypto












