

Royalty Pharma shares drop almost 6% after a downside gap and heavy early selling

Royalty Pharma plc (RPRX) dropped 5.74% today amid heavy short-term selling pressure, with price action opening lower and holding near session highs after a downside gap. The move looks limited given that recent weakness is offset by the stock's ongoing medium- and long-term bullish structure, confirmed by its placement above the 50- and 200-day moving averages.
 68.12
69.67
Highlights
- Shares of Royalty Pharma fell 5.74% to $60.28, showing short-term downward pressure below the 20-day average.
- Technical structure remains bullish long term with strong momentum signals, but several indicators register overbought conditions.
- In the next 5 days, the expected price range is $59.12 to $63.94, with a high probability of an upward move if $60.37 resistance is cleared.
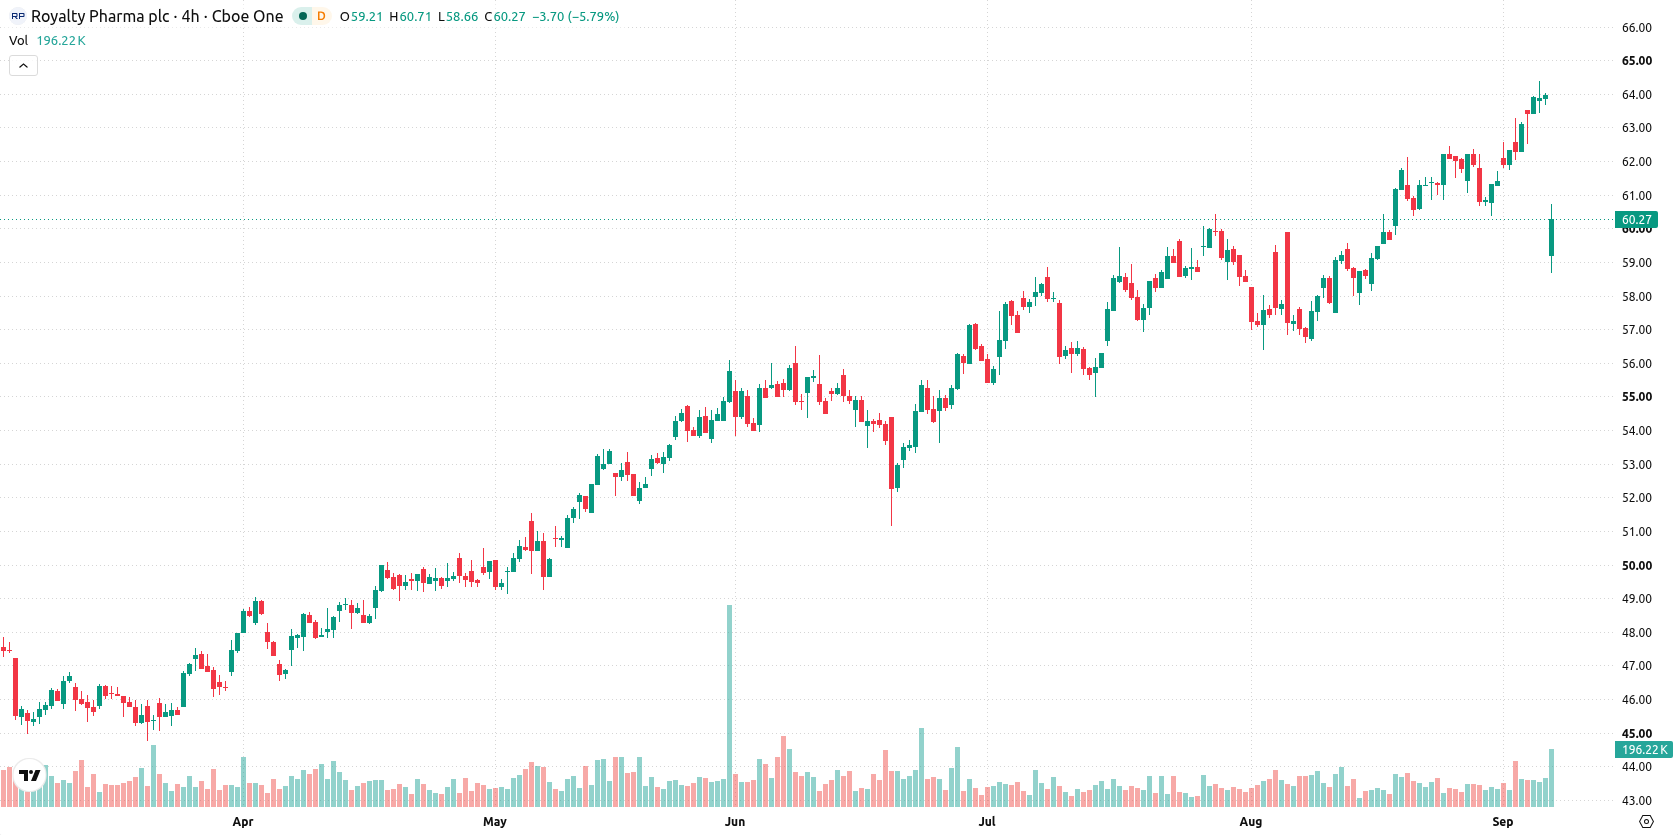
Medium-term bullish setup persists despite overbought momentum signals
Royalty Pharma is trading below its 20-day simple moving average at $60.88, but remains above both the 50-day ($58.94) and 200-day ($49.23) moving averages. This positioning points to short-term pressure from recent sellers, but confirms an intact medium- and long-term bullish structure, further supported by a bullish MA-50 vs MA-200 alignment. The nearest resistance is at $60.37, defined by the Ichimoku Kijun, with support at $59.12. Momentum indicators continue to show strength: the Moving Average Convergence Divergence (MACD) and the Average Directional Index (ADX) both signal a buy, underscoring strong bullish momentum on the daily timeframe. The Relative Strength Index (RSI), Stochastic RSI, Commodity Channel Index (CCI), and Bull/Bear Power (BBP) all indicate overbought conditions, with the BBP value confirming buyers dominate intraday momentum. The Awesome Oscillator (AO) is also positive, aligning with this bullish tone. The stock is currently trading at $60.28, slipping $3.67 or 5.74% on the day after opening with a downside gap of $4.85 (about 7.6%). Price action is near the session high, daily volatility stands at 2.66%, and the move reflects resilient strength after early selling pressure, consistent with the ongoing bullish momentum, despite clear overbought warnings.
Earlier, analysts noted that financial resilience and robust market positioning can help companies withstand competitive pressures and support growth opportunities. The current technical outlook for Royalty Pharma strengthens this view, highlighting the importance of monitoring the $59.12 support and $60.37 resistance levels as key markers for potential price direction in the coming sessions.






Latest Royalty Pharma News




-
 Afghanistan
-
 Albania
-
 Algeria
-
 Angola
-
 Argentina
-
 Armenia
-
 Australia
-
 Austria
-
 Azerbaijan
-
 Bahamas
-
 Bahrain
-
 Bangladesh
-
 Belarus
-
 Belgium
-
 Bolivia
-
 Botswana
-
 Brazil
-
 Brunei
-
 Bulgaria
-
 Cambodia
-
 Cameroon
-
 Canada
-
 Chile
-
 China
-
 Colombia
-
 Congo
-
 Costa Rica
-
 Cote d'Ivoire
-
 Croatia
-
 Cuba
-
 Cyprus
-
 Czechia
-
 DR Congo
-
 Denmark
-
 Dominican Republic
-
 Ecuador
-
 Egypt
-
 El Salvador
-
 Estonia
-
 Eswatini
-
 Ethiopia
-
 Finland
-
 France
-
 Georgia
-
 Germany
-
 Ghana
-
 Greece
-
 Haiti
-
 Hong Kong
-
 Hungary
-
 India
-
 Indonesia
-
 Iran, Islamic republic
-
 Iraq
-
 Ireland
-
 Israel
-
 Italy
-
 Jamaica
-
 Japan
-
 Jordan
-
 Kazakhstan
-
 Kenya
-
 Korea
-
 Kuwait
-
 Kyrgyzstan
-
 Laos
-
 Latvia
-
 Lebanon
-
 Lesotho
-
 Libya
-
 Lithuania
-
 Luxembourg
-
 Madagascar
-
 Malaysia
-
 Malta
-
 Mauritius
-
 Mexico
-
 Moldova
-
 Mongolia
-
 Montenegro
-
 Morocco
-
 Mozambique
-
 Myanmar
-
 Namibia
-
 Nepal
-
 Netherlands
-
 New Zealand
-
 Nigeria
-
 North Macedonia
-
 Norway
-
 Oman
-
 Pakistan
-
 Palestine
-
 Panama
-
 Papua New Guinea
-
 Paraguay
-
 Peru
-
 Philippines
-
 Poland
-
 Portugal
-
 Puerto Rico
-
 Qatar
-
 Reunion
-
 Romania
-
 Rwanda
-
 Saudi Arabia
-
 Serbia
-
 Singapore
-
 Slovakia
-
 Slovenia
-
 Somalia
-
 South Africa
-
 Spain
-
 Sri Lanka
-
 Sweden
-
 Switzerland
-
 Syria
-
 Taiwan
-
 Tajikistan
-
 Tanzania
-
 Thailand
-
 Trinidad and Tobago
-
 Tunisia
-
 Turkey
-
 UAE
-
 Uganda
-
 Ukraine
-
 United Kingdom
-
United States
-
 Uruguay
-
 Uzbekistan
-
 Venezuela
-
 Vietnam
-
 Yemen
-
 Zambia
-
 Zimbabwe
- Forex
- Crypto












