

Vodafone shares technical analysis: Seller pressure threatens GBX116.66 downside risk point

Vodafone (VOD) stock is trading at GBX118.4 after a modest decline on the day, with the price currently positioned below its key short- and medium-term moving averages but holding above the long-term average.
 117.51
122.55
Highlights
- Vodafone España must pay €2,372,344.83 plus interest to a former partner due to a Supreme Court ruling involving agency contract contributions.
- This payment imposes a direct financial outflow and resolves a legal risk, clarifying Vodafone España's liability profile in Spain.
- Shares of Vodafone closed at GBX118.4, trading below key moving averages as bearish technical signals suggest high downside risk within a GBX116.66 to GBX120.93 range.
Legal payment strains liquidity as Spanish court rules against Vodafone
Vodafone España was recently ordered by the Civil Chamber of the Spanish Supreme Court to pay €2,372,344.83 plus legal interest to a former partner, following a dispute over client contributions after an agency contract was not renewed, according to Eldigitaldealbacete. This judicial ruling results in a direct financial outflow for the company, which may complicate near-term balance sheet flexibility. The resolution of an ongoing legal liability also brings some clarity to Vodafone’s legal risk profile in Spain.
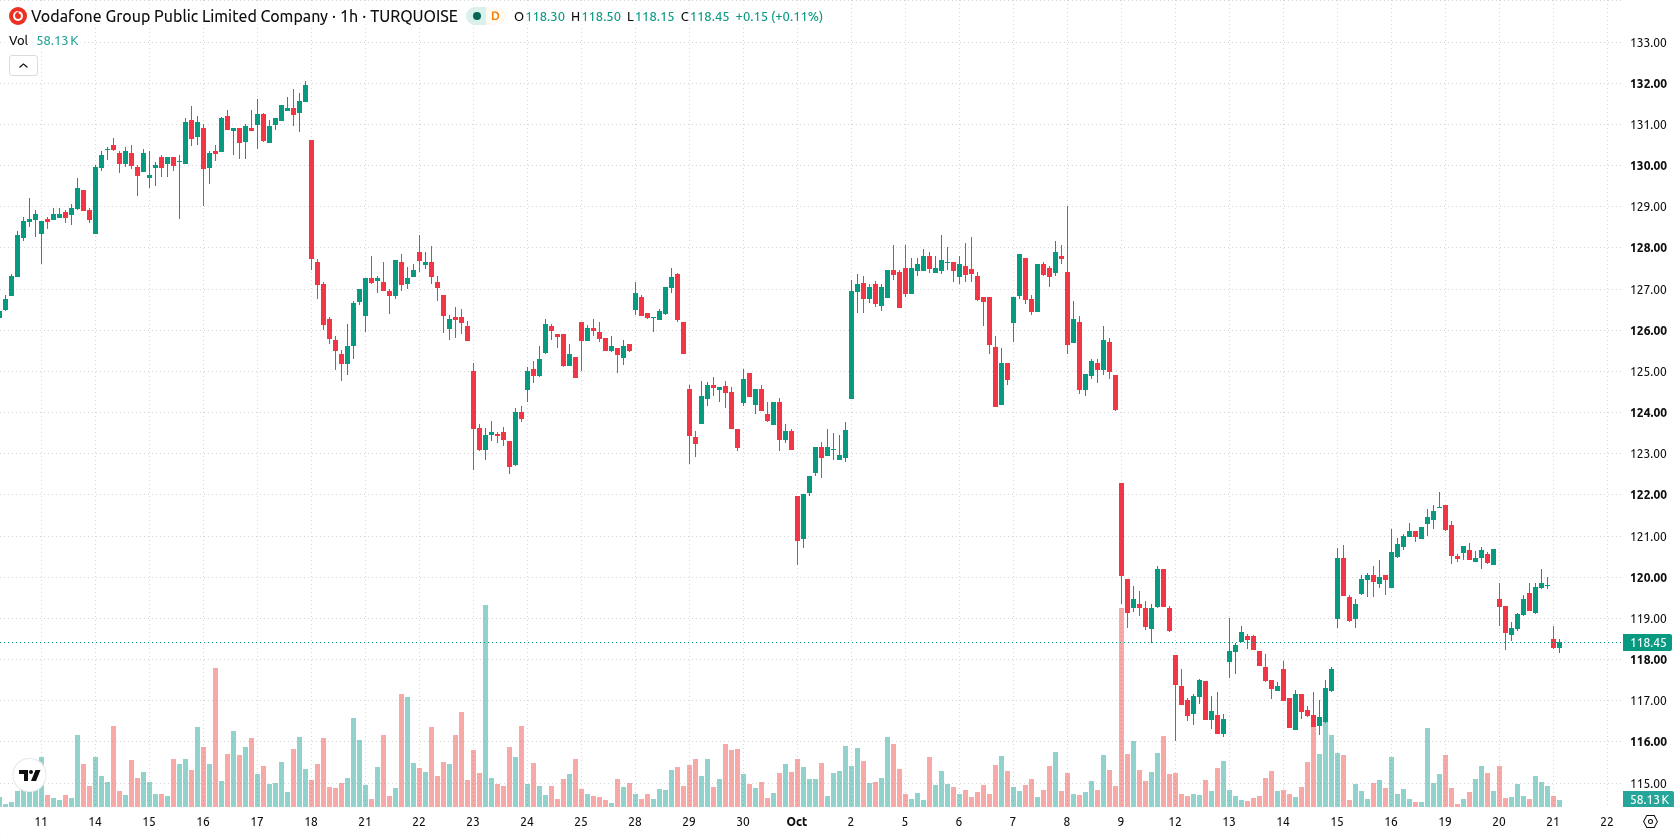
Bearish momentum entrenched as technical resistance caps intraday gains
On the hourly chart, VOD is trading below both the MA-20 at GBX120.01 and the MA-50 at GBX119.38, but remains above the MA-200 on the daily at GBX114.19. The Ichimoku Kijun sits at GBX120.18, currently serving as immediate resistance. Technical support is found at GBX116.66, while resistance is defined near GBX120.93. Momentum indicators reflect a weak structure: MACD is on a Sell signal, ADX is Neutral, and RSI at 38.36 also indicates downside pressure. CCI, Stochastic RSI, and Bull/Bear Power are deeply in oversold territory, confirming intraday bearish momentum, while the Awesome Oscillator is neutral.
Downside risk prevails as range-bound trade expected to persist
Over the next few sessions, expected trading is likely to remain within the band of GBX116.66 to GBX120.93 given prevailing volatility. The probability of a further move lower is high, while a sharp upside reversal is seen as unlikely in the short term. A baseline scenario calls for price stabilization in this range; a bullish breakout would require a sustained move above GBX120.18, while a drop below GBX116.66 would reinforce additional downside risk.
Earlier, analysts noted that Vodafone faced prevailing downside risks amid bearish technical signals and the absence of strong near-term catalysts. The latest financial penalty and continued weak momentum indicators reinforce this cautious outlook, making a sustained move above the GBX120.18 resistance the key level to watch for any potential bullish shift.










-
 Afghanistan
-
 Albania
-
 Algeria
-
 Angola
-
 Argentina
-
 Armenia
-
 Australia
-
 Austria
-
 Azerbaijan
-
 Bahamas
-
 Bahrain
-
 Bangladesh
-
 Belarus
-
 Belgium
-
 Bolivia
-
 Botswana
-
 Brazil
-
 Brunei
-
 Bulgaria
-
 Cambodia
-
 Cameroon
-
 Canada
-
 Chile
-
 China
-
 Colombia
-
 Congo
-
 Costa Rica
-
 Cote d'Ivoire
-
 Croatia
-
 Cuba
-
 Cyprus
-
 Czechia
-
 DR Congo
-
 Denmark
-
 Dominican Republic
-
 Ecuador
-
 Egypt
-
 El Salvador
-
 Estonia
-
 Eswatini
-
 Ethiopia
-
 Finland
-
 France
-
 Georgia
-
 Germany
-
 Ghana
-
 Greece
-
 Haiti
-
 Hong Kong
-
 Hungary
-
 India
-
 Indonesia
-
 Iran, Islamic republic
-
 Iraq
-
 Ireland
-
 Israel
-
 Italy
-
 Jamaica
-
 Japan
-
 Jordan
-
 Kazakhstan
-
 Kenya
-
 Korea
-
 Kuwait
-
 Kyrgyzstan
-
 Laos
-
 Latvia
-
 Lebanon
-
 Lesotho
-
 Libya
-
 Lithuania
-
 Luxembourg
-
 Madagascar
-
 Malaysia
-
 Malta
-
 Mauritius
-
 Mexico
-
 Moldova
-
 Mongolia
-
 Montenegro
-
 Morocco
-
 Mozambique
-
 Myanmar
-
 Namibia
-
 Nepal
-
 Netherlands
-
 New Zealand
-
 Nigeria
-
 North Macedonia
-
 Norway
-
 Oman
-
 Pakistan
-
 Palestine
-
 Panama
-
 Papua New Guinea
-
 Paraguay
-
 Peru
-
 Philippines
-
 Poland
-
 Portugal
-
 Puerto Rico
-
 Qatar
-
 Reunion
-
 Romania
-
 Rwanda
-
 Saudi Arabia
-
 Serbia
-
 Singapore
-
 Slovakia
-
 Slovenia
-
 Somalia
-
 South Africa
-
 Spain
-
 Sri Lanka
-
 Sweden
-
 Switzerland
-
 Syria
-
 Taiwan
-
 Tajikistan
-
 Tanzania
-
 Thailand
-
 Trinidad and Tobago
-
 Tunisia
-
 Turkey
-
 UAE
-
 Uganda
-
 Ukraine
-
 United Kingdom
-
United States
-
 Uruguay
-
 Uzbekistan
-
 Venezuela
-
 Vietnam
-
 Yemen
-
 Zambia
-
 Zimbabwe
- Forex
- Crypto












