

National Grid shares technical analysis: Price remains steady with buyer support at GBX1,201

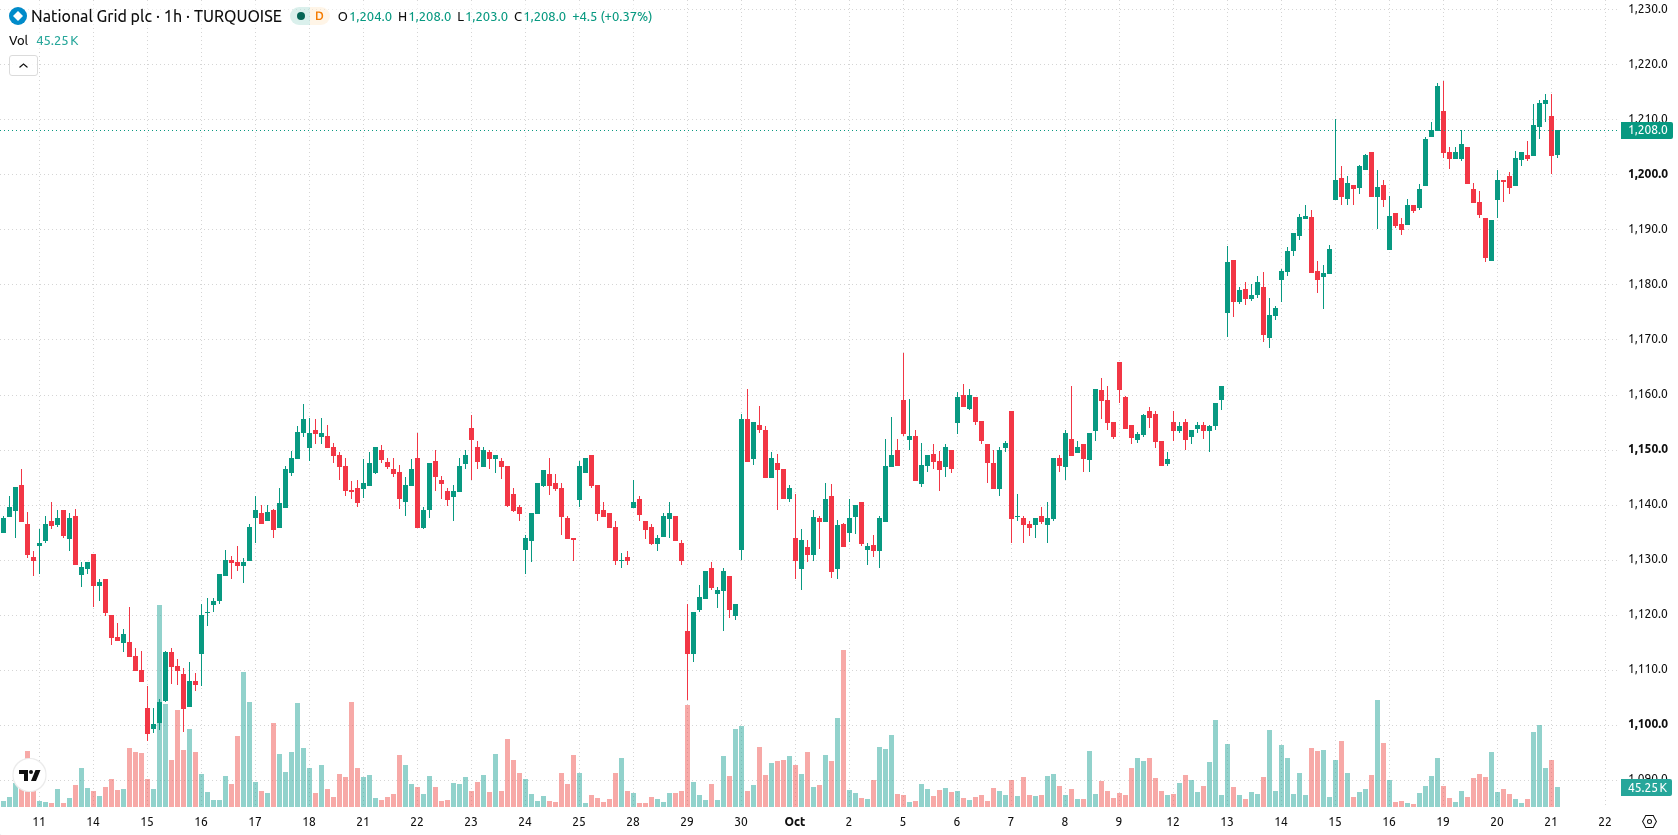
National Grid (NG) stock is trading at GBX1,208, marking a slight decrease on the day. The price remains above short- and medium-term moving averages, but is still beneath its long-term trend level.
 1256.00
1262.50
Highlights
- Shares of National Grid remain above short- and medium-term averages but face long-term resistance, indicating mixed trend strength.
- Momentum indicators mostly favor buyers, with several showing overbought conditions and some mixed signals that imply possible short-term volatility.
- The projected trading range for the coming sessions is GBX1,192 to GBX1,223, with very high probability of sideways or upward movement.
Mixed momentum and overbought signals as buyers test ceiling
On the technical front, the price of NG sits above the MA-20 and MA-50 but remains under the MA-200 level on the daily chart. The Ichimoku Kijun line at GBX1,201 is acting as immediate support. Bullish momentum is reflected in MACD (Buy), RSI at 56.41 (Buy), CCI (Buy), and the Awesome Oscillator (Buy), while the ADX and Stochastic RSI are neutral. Bull/Bear Power is in overbought territory, suggesting strong buying activity but also potential for near-term exhaustion. The day featured a positive opening gap and moderate volatility, with some divergence between mixed momentum readings indicating choppy intraday conditions.
High breakout odds as volatility narrows risk corridor
Looking ahead, NG is projected to trade within a range of GBX1,192 to GBX1,223 in the near term, based on typical volatility around current price levels. The probability of an upward breakout is considered very high, while downside risk appears minimal for now. The baseline scenario envisions sideways movement within this corridor, but a break above resistance could prompt further gains. Conversely, a fall below support would increase the risk of accelerated declines.
Earlier, analysts noted that National Grid was demonstrating short- to medium-term technical strength, but continued to face longer-term resistance and the possibility of price consolidation. Current technical signals reinforce this view, with mixed momentum readings suggesting that traders should monitor the GBX1,201 support level for signs of either sustained stability or a bearish shift should it fail.









-
 Afghanistan
-
 Albania
-
 Algeria
-
 Angola
-
 Argentina
-
 Armenia
-
 Australia
-
 Austria
-
 Azerbaijan
-
 Bahamas
-
 Bahrain
-
 Bangladesh
-
 Belarus
-
 Belgium
-
 Bolivia
-
 Botswana
-
 Brazil
-
 Brunei
-
 Bulgaria
-
 Cambodia
-
 Cameroon
-
 Canada
-
 Chile
-
 China
-
 Colombia
-
 Congo
-
 Costa Rica
-
 Cote d'Ivoire
-
 Croatia
-
 Cuba
-
 Cyprus
-
 Czechia
-
 DR Congo
-
 Denmark
-
 Dominican Republic
-
 Ecuador
-
 Egypt
-
 El Salvador
-
 Estonia
-
 Eswatini
-
 Ethiopia
-
 Finland
-
 France
-
 Georgia
-
 Germany
-
 Ghana
-
 Greece
-
 Haiti
-
 Hong Kong
-
 Hungary
-
 India
-
 Indonesia
-
 Iran, Islamic republic
-
 Iraq
-
 Ireland
-
 Israel
-
 Italy
-
 Jamaica
-
 Japan
-
 Jordan
-
 Kazakhstan
-
 Kenya
-
 Korea
-
 Kuwait
-
 Kyrgyzstan
-
 Laos
-
 Latvia
-
 Lebanon
-
 Lesotho
-
 Libya
-
 Lithuania
-
 Luxembourg
-
 Madagascar
-
 Malaysia
-
 Malta
-
 Mauritius
-
 Mexico
-
 Moldova
-
 Mongolia
-
 Montenegro
-
 Morocco
-
 Mozambique
-
 Myanmar
-
 Namibia
-
 Nepal
-
 Netherlands
-
 New Zealand
-
 Nigeria
-
 North Macedonia
-
 Norway
-
 Oman
-
 Pakistan
-
 Palestine
-
 Panama
-
 Papua New Guinea
-
 Paraguay
-
 Peru
-
 Philippines
-
 Poland
-
 Portugal
-
 Puerto Rico
-
 Qatar
-
 Reunion
-
 Romania
-
 Rwanda
-
 Saudi Arabia
-
 Serbia
-
 Singapore
-
 Slovakia
-
 Slovenia
-
 Somalia
-
 South Africa
-
 Spain
-
 Sri Lanka
-
 Sweden
-
 Switzerland
-
 Syria
-
 Taiwan
-
 Tajikistan
-
 Tanzania
-
 Thailand
-
 Trinidad and Tobago
-
 Tunisia
-
 Turkey
-
 UAE
-
 Uganda
-
 Ukraine
-
 United Kingdom
-
United States
-
 Uruguay
-
 Uzbekistan
-
 Venezuela
-
 Vietnam
-
 Yemen
-
 Zambia
-
 Zimbabwe
- Forex
- Crypto












