

Meta Platforms stock declines amid ongoing seller pressure

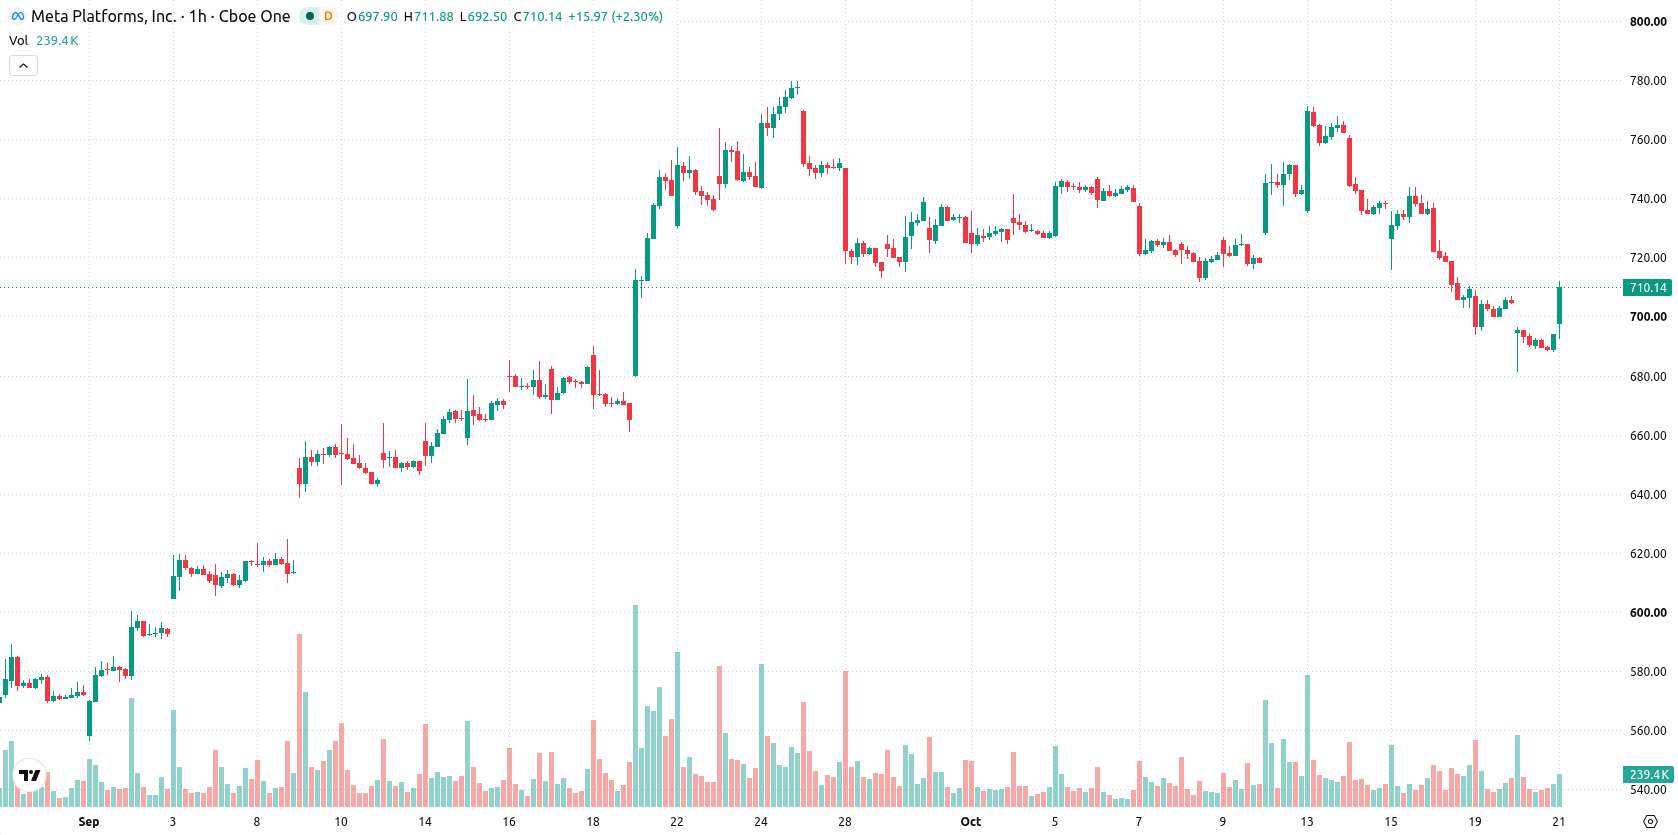
Meta Platforms (META) stock is trading at $693.29, marking a daily decline of 1.72% as it moves lower on moderate volatility. The price sits below its key moving averages, reflecting short-term weakness.
 634.66
648.01
Highlights
- META/USD trades below key short- and medium-term moving averages on the hourly chart, signaling persistent selling pressure.
- Momentum indicators show mostly negative signals, with sellers dominating and oversold conditions across several oscillators.
- Expected short-term trading range is $664.18 to $722.4, with a 77% probability of continued downside and limited rebound likelihood.
Seller dominance persists as negative momentum meets key resistance
On the hourly chart, META is trading below the MA-20 at $701.73 and MA-50 at $727.88, while the daily MA-200 at $632.4 provides longer-term support. The Ichimoku Kijun on the daily timeframe stands at $712.51 and acts as immediate resistance. Momentum indicators remain negative: both MACD and ADX reflect sustained selling pressure. The RSI is at 36.41, the CCI and Bull/Bear Power indicate oversold conditions and continued seller dominance, but Stoch RSI being overbought introduces a notable divergence. The Awesome Oscillator is neutral, offering no strong directional reinforcement.
Downside risk favored as range-bound trading drives uncertainty
In the short term, META is expected to trade within a $664.18–$722.4 range, reflecting a typical volatility band relative to current levels. There is a 23% probability of an upward move against a 77% likelihood of continued downside, suggesting a rebound is less probable in the near term. Should the price remain inside this corridor, trading may turn choppy and range-bound; a clear breakout above $712.51 would support a recovery scenario, while a decisive drop below $664.18 could trigger another leg lower and accelerate selling.
Earlier, analysts noted that Meta's move to restrict ByteDance from advertising on its platforms reflects intensifying competition in digital advertising and broader shifts in ad budget allocation. As technical weakness persists in Meta’s stock and volatility remains elevated, traders should focus on the $664.18 level as a critical downside risk if current support fails.






Latest META News





-
 Afghanistan
-
 Albania
-
 Algeria
-
 Angola
-
 Argentina
-
 Armenia
-
 Australia
-
 Austria
-
 Azerbaijan
-
 Bahamas
-
 Bahrain
-
 Bangladesh
-
 Belarus
-
 Belgium
-
 Bolivia
-
 Botswana
-
 Brazil
-
 Brunei
-
 Bulgaria
-
 Cambodia
-
 Cameroon
-
 Canada
-
 Chile
-
 China
-
 Colombia
-
 Congo
-
 Costa Rica
-
 Cote d'Ivoire
-
 Croatia
-
 Cuba
-
 Cyprus
-
 Czechia
-
 DR Congo
-
 Denmark
-
 Dominican Republic
-
 Ecuador
-
 Egypt
-
 El Salvador
-
 Estonia
-
 Eswatini
-
 Ethiopia
-
 Finland
-
 France
-
 Georgia
-
 Germany
-
 Ghana
-
 Greece
-
 Haiti
-
 Hong Kong
-
 Hungary
-
 India
-
 Indonesia
-
 Iran, Islamic republic
-
 Iraq
-
 Ireland
-
 Israel
-
 Italy
-
 Jamaica
-
 Japan
-
 Jordan
-
 Kazakhstan
-
 Kenya
-
 Korea
-
 Kuwait
-
 Kyrgyzstan
-
 Laos
-
 Latvia
-
 Lebanon
-
 Lesotho
-
 Libya
-
 Lithuania
-
 Luxembourg
-
 Madagascar
-
 Malaysia
-
 Malta
-
 Mauritius
-
 Mexico
-
 Moldova
-
 Mongolia
-
 Montenegro
-
 Morocco
-
 Mozambique
-
 Myanmar
-
 Namibia
-
 Nepal
-
 Netherlands
-
 New Zealand
-
 Nigeria
-
 North Macedonia
-
 Norway
-
 Oman
-
 Pakistan
-
 Palestine
-
 Panama
-
 Papua New Guinea
-
 Paraguay
-
 Peru
-
 Philippines
-
 Poland
-
 Portugal
-
 Puerto Rico
-
 Qatar
-
 Reunion
-
 Romania
-
 Rwanda
-
 Saudi Arabia
-
 Serbia
-
 Singapore
-
 Slovakia
-
 Slovenia
-
 Somalia
-
 South Africa
-
 Spain
-
 Sri Lanka
-
 Sweden
-
 Switzerland
-
 Syria
-
 Taiwan
-
 Tajikistan
-
 Tanzania
-
 Thailand
-
 Trinidad and Tobago
-
 Tunisia
-
 Turkey
-
 UAE
-
 Uganda
-
 Ukraine
-
 United Kingdom
-
United States
-
 Uruguay
-
 Uzbekistan
-
 Venezuela
-
 Vietnam
-
 Yemen
-
 Zambia
-
 Zimbabwe
- Forex
- Crypto












