

Will Suncor Energy stock break higher as quarterly earnings catalyst approaches?

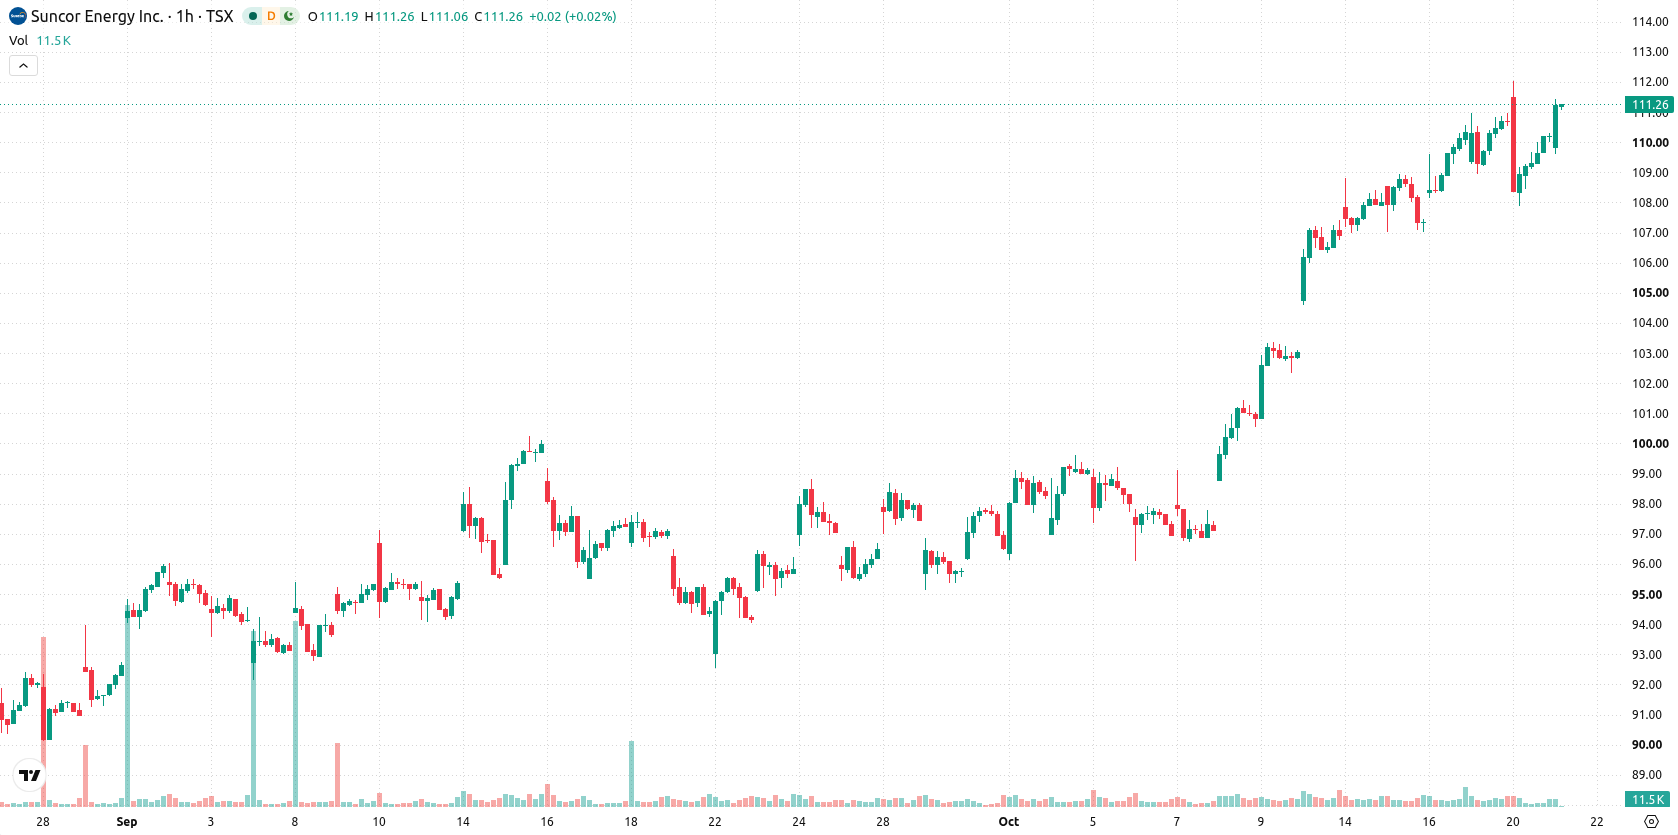
Suncor Energy (SU) stock is trading at C$111.06 after a modest move higher today, ending near the top of its daily range. The stock remains above its key moving averages, reflecting continued strength on both short- and long-term timeframes.
 99.76
99.76
Highlights
- Suncor Energy will release its third quarter 2026 financial results on November 3 with a management webcast and Q and A the next day.
- Shares of Suncor reached a new 52-week high and a market capitalization milestone on October 20, 2026, as investor focus turns to upcoming earnings.
- Suncor stock maintains a bullish trend across all timeframes, with the price expected to trade between C$108.89 and C$113.23 over the next two to three days.
Investor positioning adjusts as earnings date and record high approach
Suncor Energy has set its third quarter 2026 financial results release for November 3, with a management webcast and Q&A to follow the next day, as reported by Yahoo Finance. This upcoming earnings announcement acts as a focal point for investor positioning, with market participants likely adjusting ahead of new financial disclosures and forward guidance. In the lead-up, the stock achieved a fresh 52-week high and market capitalization milestone on October 20, 2026, according to 247wallst, reinforcing attention on Suncor's capital markets profile as anticipation builds around the forthcoming quarterly results.
Mixed momentum and overbought signals as technical support holds
On the technical side, SU remains above the MA-20 at C$109.72 and the MA-50 at C$107.65 on the hourly chart, while also holding above the MA-200 at C$86.09 on the daily timeframe. The Ichimoku Kijun daily level at C$109.53 currently defines immediate support for the stock. Momentum indicators present a mixed but mostly positive picture: MACD signals Strong Buy, ADX is on Buy, and both RSI at 61.05 and CCI fall within buy territory. Stoch RSI is neutral, suggesting conditions may be getting stretched near term, while Bull/Bear Power indicates buyers remain dominant, though its overbought reading and neutral Awesome Oscillator highlight potential for a short-term pause.
Upside risk intensifies if resistance breaks amid tight range
Looking to the short term, the expected trading corridor over the next 2–3 sessions is C$108.89 to C$113.23, reflecting typical volatility bands. The most probable scenario is for SU to hold within this range, with a high probability of further upside if resistance at C$113.23 is surpassed decisively. A break above this level would confirm momentum and could trigger additional buying. Conversely, if price slips below C$108.89, it would activate support from recent moving averages and the daily Kijun, pointing to short-term downside risk.
Earlier, analysts noted that Suncor Energy's technical outlook had softened, with price action consolidating below short-term resistance but remaining broadly stable. The latest analysis signals renewed strength as the stock trades above key moving averages, with attention now focused on a potential breakout above C$113.23 as the next crucial level for directional momentum.






Latest Suncor Energy News


-
 Afghanistan
-
 Albania
-
 Algeria
-
 Angola
-
 Argentina
-
 Armenia
-
 Australia
-
 Austria
-
 Azerbaijan
-
 Bahamas
-
 Bahrain
-
 Bangladesh
-
 Belarus
-
 Belgium
-
 Bolivia
-
 Botswana
-
 Brazil
-
 Brunei
-
 Bulgaria
-
 Cambodia
-
 Cameroon
-
 Canada
-
 Chile
-
 China
-
 Colombia
-
 Congo
-
 Costa Rica
-
 Cote d'Ivoire
-
 Croatia
-
 Cuba
-
 Cyprus
-
 Czechia
-
 DR Congo
-
 Denmark
-
 Dominican Republic
-
 Ecuador
-
 Egypt
-
 El Salvador
-
 Estonia
-
 Eswatini
-
 Ethiopia
-
 Finland
-
 France
-
 Georgia
-
 Germany
-
 Ghana
-
 Greece
-
 Haiti
-
 Hong Kong
-
 Hungary
-
 India
-
 Indonesia
-
 Iran, Islamic republic
-
 Iraq
-
 Ireland
-
 Israel
-
 Italy
-
 Jamaica
-
 Japan
-
 Jordan
-
 Kazakhstan
-
 Kenya
-
 Korea
-
 Kuwait
-
 Kyrgyzstan
-
 Laos
-
 Latvia
-
 Lebanon
-
 Lesotho
-
 Libya
-
 Lithuania
-
 Luxembourg
-
 Madagascar
-
 Malaysia
-
 Malta
-
 Mauritius
-
 Mexico
-
 Moldova
-
 Mongolia
-
 Montenegro
-
 Morocco
-
 Mozambique
-
 Myanmar
-
 Namibia
-
 Nepal
-
 Netherlands
-
 New Zealand
-
 Nigeria
-
 North Macedonia
-
 Norway
-
 Oman
-
 Pakistan
-
 Palestine
-
 Panama
-
 Papua New Guinea
-
 Paraguay
-
 Peru
-
 Philippines
-
 Poland
-
 Portugal
-
 Puerto Rico
-
 Qatar
-
 Reunion
-
 Romania
-
 Rwanda
-
 Saudi Arabia
-
 Serbia
-
 Singapore
-
 Slovakia
-
 Slovenia
-
 Somalia
-
 South Africa
-
 Spain
-
 Sri Lanka
-
 Sweden
-
 Switzerland
-
 Syria
-
 Taiwan
-
 Tajikistan
-
 Tanzania
-
 Thailand
-
 Trinidad and Tobago
-
 Tunisia
-
 Turkey
-
 UAE
-
 Uganda
-
 Ukraine
-
 United Kingdom
-
United States
-
 Uruguay
-
 Uzbekistan
-
 Venezuela
-
 Vietnam
-
 Yemen
-
 Zambia
-
 Zimbabwe
- Forex
- Crypto












