


Suncor Energy Inc. (SU) advanced 2.02% after reporting record third-quarter results and announcing a dividend increase and expanded buybacks, drawing renewed buying interest. However, the rebound looks limited, with SU trading below its 20-day and 50-day moving averages and encountering overhead resistance.
 99.76
99.76
Highlights
- Suncor Energy posted record third-quarter adjusted funds from operations of C$6.7 billion and free funds flow of C$5.2 billion.
- The company raised its dividend by 10%, increased share buybacks to C$750 million per month, and returned over C$2 billion to shareholders.
- Shares of Suncor Energy trade below short- and medium-term moving averages with a weak momentum profile and a five-day forecast range of C$92.98 to C$103.14.
Record cash flow and shareholder returns spur institutional buying
Suncor Energy reported record third-quarter adjusted funds from operations of C$6.7 billion and free funds flow of C$5.2 billion, driven by strong production and refining performance. The company boosted its dividend by 10% and increased monthly share buybacks to C$750 million from October. Suncor ended the quarter with C$1.8 billion in net debt and returned over C$2 billion to shareholders through share repurchases and dividends. Institutional investor MFF Capital Investments Ltd also acquired a new stake in the company, purchasing 46,000 shares during the third quarter.
Short- and medium-term weakness persists as momentum fades
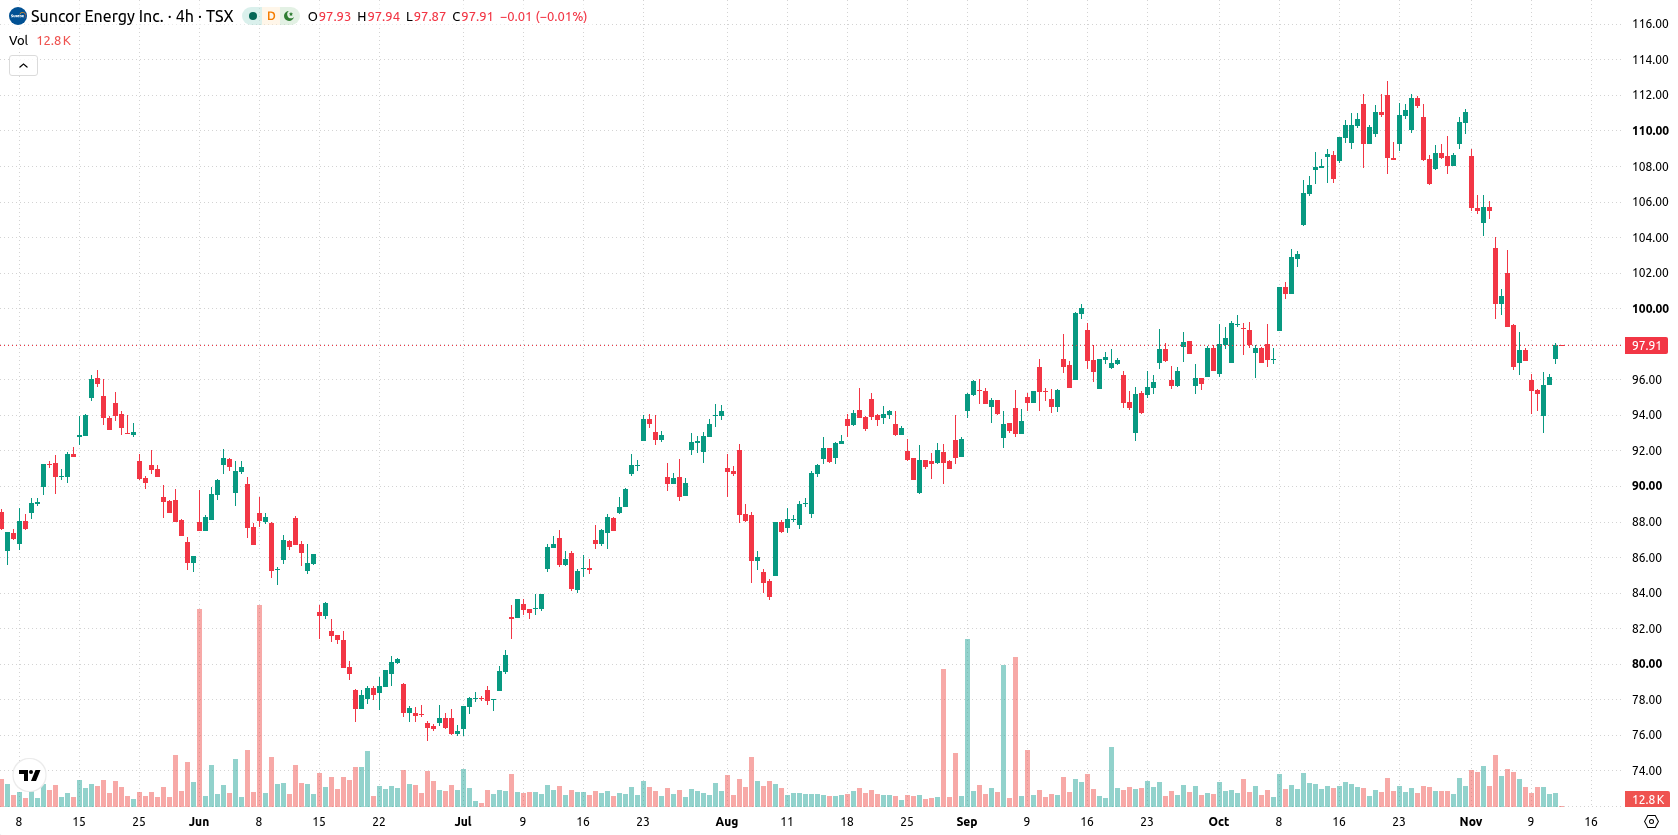
SU is trading below both its 20-day and 50-day moving averages (C$106.03 and C$100.51), but remains well above its 200-day moving average (C$88.97), reflecting short- and medium-term pressure within a bullish long-term structure. Immediate resistance is situated at C$100.51, with near-term support at today’s high of C$97.63. The Ichimoku Kijun line (C$102.81) reinforces the resistance zone. Short-term momentum is weak, the MACD is neutral, and the ADX signals a downtrend. Among oscillators, the RSI is neutral, while the Stochastic RSI and CCI are in their respective oversold zones, highlighting potential for a short-term rebound but without confirmation from the RSI. BBP is negative, indicating sellers dominate intraday momentum. The stock's intraday advance, opening gap, and volatility at 0.76% reflect some intraday strength, despite underlying bearish momentum.
Earlier, analysts noted that despite Suncor Energy's robust financial performance and increased shareholder payouts, the stock faced near-term technical pressure and heightened downside risk. The latest data reinforce this cautious outlook, with Suncor remaining vulnerable to further declines unless it can decisively clear resistance at C$100.51.






Latest Suncor Energy News


-
 Afghanistan
-
 Albania
-
 Algeria
-
 Angola
-
 Argentina
-
 Armenia
-
 Australia
-
 Austria
-
 Azerbaijan
-
 Bahamas
-
 Bahrain
-
 Bangladesh
-
 Belarus
-
 Belgium
-
 Bolivia
-
 Botswana
-
 Brazil
-
 Brunei
-
 Bulgaria
-
 Cambodia
-
 Cameroon
-
 Canada
-
 Chile
-
 China
-
 Colombia
-
 Congo
-
 Costa Rica
-
 Cote d'Ivoire
-
 Croatia
-
 Cuba
-
 Cyprus
-
 Czechia
-
 DR Congo
-
 Denmark
-
 Dominican Republic
-
 Ecuador
-
 Egypt
-
 El Salvador
-
 Estonia
-
 Eswatini
-
 Ethiopia
-
 Finland
-
 France
-
 Georgia
-
 Germany
-
 Ghana
-
 Greece
-
 Haiti
-
 Hong Kong
-
 Hungary
-
 India
-
 Indonesia
-
 Iran, Islamic republic
-
 Iraq
-
 Ireland
-
 Israel
-
 Italy
-
 Jamaica
-
 Japan
-
 Jordan
-
 Kazakhstan
-
 Kenya
-
 Korea
-
 Kuwait
-
 Kyrgyzstan
-
 Laos
-
 Latvia
-
 Lebanon
-
 Lesotho
-
 Libya
-
 Lithuania
-
 Luxembourg
-
 Madagascar
-
 Malaysia
-
 Malta
-
 Mauritius
-
 Mexico
-
 Moldova
-
 Mongolia
-
 Montenegro
-
 Morocco
-
 Mozambique
-
 Myanmar
-
 Namibia
-
 Nepal
-
 Netherlands
-
 New Zealand
-
 Nigeria
-
 North Macedonia
-
 Norway
-
 Oman
-
 Pakistan
-
 Palestine
-
 Panama
-
 Papua New Guinea
-
 Paraguay
-
 Peru
-
 Philippines
-
 Poland
-
 Portugal
-
 Puerto Rico
-
 Qatar
-
 Reunion
-
 Romania
-
 Rwanda
-
 Saudi Arabia
-
 Serbia
-
 Singapore
-
 Slovakia
-
 Slovenia
-
 Somalia
-
 South Africa
-
 Spain
-
 Sri Lanka
-
 Sweden
-
 Switzerland
-
 Syria
-
 Taiwan
-
 Tajikistan
-
 Tanzania
-
 Thailand
-
 Trinidad and Tobago
-
 Tunisia
-
 Turkey
-
 UAE
-
 Uganda
-
 Ukraine
-
 United Kingdom
-
United States
-
 Uruguay
-
 Uzbekistan
-
 Venezuela
-
 Vietnam
-
 Yemen
-
 Zambia
-
 Zimbabwe
- Forex
- Crypto












