

Suncor Energy announces higher dividend: SU remains range-bound

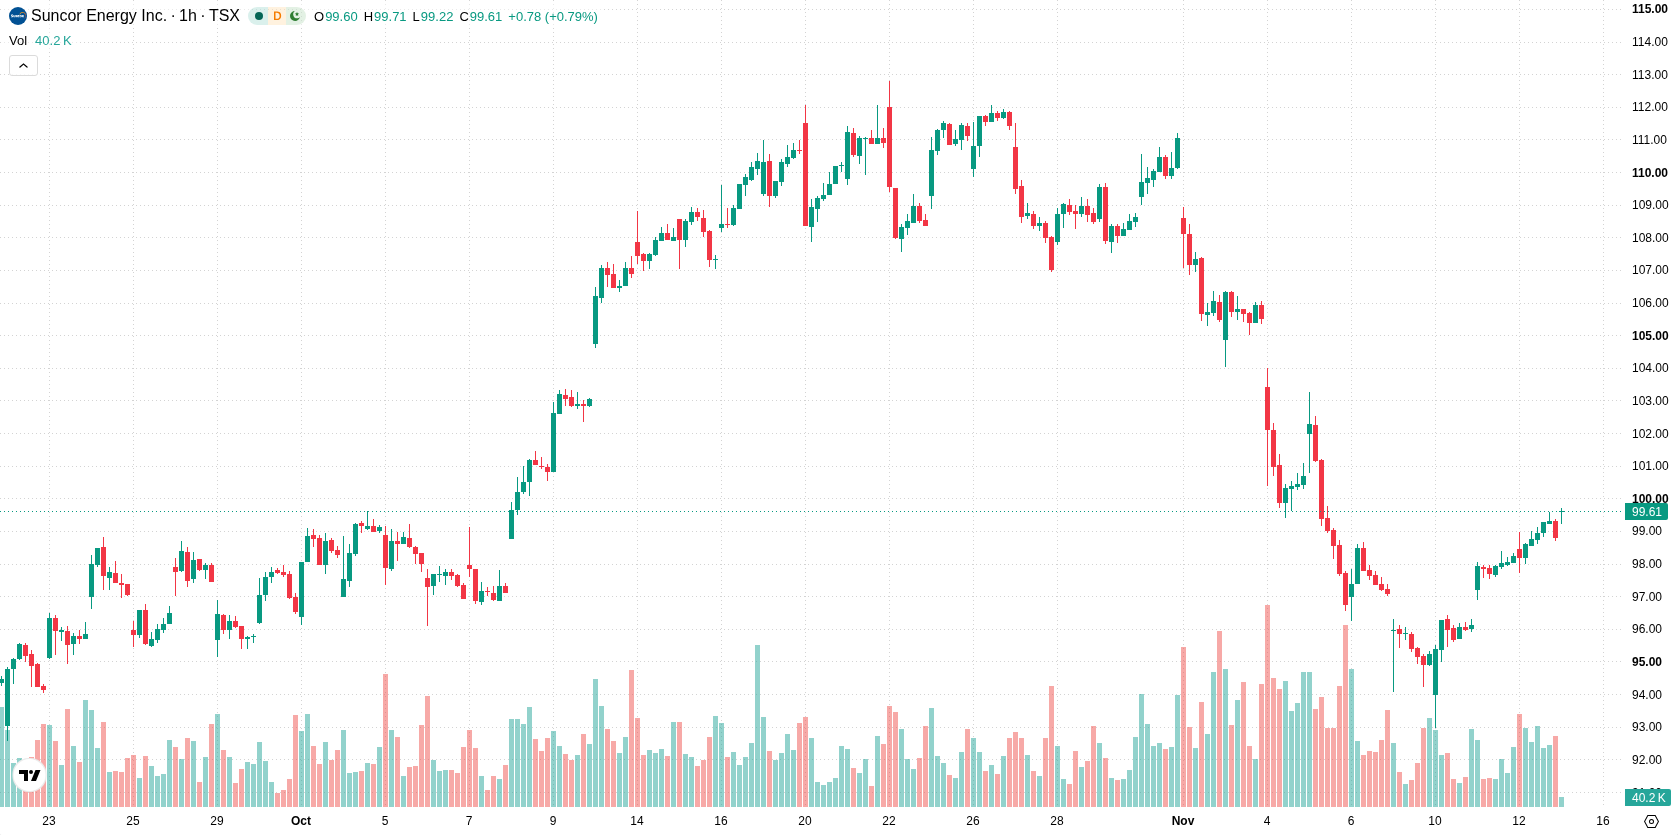
Suncor Energy (SU) stock is trading at C$98.72, showing a marginal decline in today's session. The price remains above its key moving averages, indicating resilience relative to recent trends.
 99.76
99.76
Highlights
- Suncor Energy has raised its quarterly dividend by 10%, bringing the annual payout to $2.64 per share.
- The higher dividend yield increases the stock's attractiveness to income-oriented investors and supports shareholder value.
- Shares of Suncor Energy trade above key moving averages with positive momentum signals; the expected 2 to 3 day range is C$95.77 to C$101.67.
Dividend hike boosts yield and appeal amid shareholder focus
Suncor Energy has increased its quarterly dividend by 10%, bringing the annual payout to $2.64 per share, with the new rate payable on December 24 to shareholders of record as of December 3, according to Baystreet. This enhanced dividend offers a higher yield, which can improve the stock's appeal among income-oriented investors and may bolster shareholder value perception. The action reflects ongoing financial discipline and a continued focus on rewarding shareholders through direct capital returns.
Buy signals persist with upside momentum and defined support
On the technical front, SU trades above the MA-20 (C$97.69) and MA-50 (C$98.12) on the hourly chart, as well as the MA-200 (C$89.25) on the daily timeframe. The Ichimoku Kijun sits at C$96.27, providing an immediate support level, while resistance is observed near C$101.67 and support around C$95.77. MACD and ADX are generating buy signals, confirming positive momentum. Oscillators including RSI (57.9), Stoch RSI (45.3), and CCI (88.73) remain within neutral ranges, with no immediate signs of overbought or oversold conditions; Bull/Bear Power at 0.99 and the Awesome Oscillator both highlight continued buyer dominance during today's moderate volatility.
Volatility band holds as breakout levels set direction risk
Over the next two to three trading days, SU is expected to fluctuate within the C$95.77 to C$101.67 volatility band relative to current levels. Price action may turn sideways if the current range holds. A sustained move above resistance would favor a bullish scenario with further gains, while a drop below support at C$95.77 could trigger a bearish turn.
Earlier, analysts noted that despite Suncor Energy’s solid financial performance and stable dividend, technical conditions suggested limited near-term upside with downside risk predominating. The latest dividend increase and strengthened technical momentum introduce a more constructive setup, making the C$101.67 resistance level critical to watch for confirmation of sustained bullish progress.






Latest Suncor Energy News



-
 Afghanistan
-
 Albania
-
 Algeria
-
 Angola
-
 Argentina
-
 Armenia
-
 Australia
-
 Austria
-
 Azerbaijan
-
 Bahamas
-
 Bahrain
-
 Bangladesh
-
 Belarus
-
 Belgium
-
 Bolivia
-
 Botswana
-
 Brazil
-
 Brunei
-
 Bulgaria
-
 Cambodia
-
 Cameroon
-
 Canada
-
 Chile
-
 China
-
 Colombia
-
 Congo
-
 Costa Rica
-
 Cote d'Ivoire
-
 Croatia
-
 Cuba
-
 Cyprus
-
 Czechia
-
 DR Congo
-
 Denmark
-
 Dominican Republic
-
 Ecuador
-
 Egypt
-
 El Salvador
-
 Estonia
-
 Eswatini
-
 Ethiopia
-
 Finland
-
 France
-
 Georgia
-
 Germany
-
 Ghana
-
 Greece
-
 Haiti
-
 Hong Kong
-
 Hungary
-
 India
-
 Indonesia
-
 Iran, Islamic republic
-
 Iraq
-
 Ireland
-
 Israel
-
 Italy
-
 Jamaica
-
 Japan
-
 Jordan
-
 Kazakhstan
-
 Kenya
-
 Korea
-
 Kuwait
-
 Kyrgyzstan
-
 Laos
-
 Latvia
-
 Lebanon
-
 Lesotho
-
 Libya
-
 Lithuania
-
 Luxembourg
-
 Madagascar
-
 Malaysia
-
 Malta
-
 Mauritius
-
 Mexico
-
 Moldova
-
 Mongolia
-
 Montenegro
-
 Morocco
-
 Mozambique
-
 Myanmar
-
 Namibia
-
 Nepal
-
 Netherlands
-
 New Zealand
-
 Nigeria
-
 North Macedonia
-
 Norway
-
 Oman
-
 Pakistan
-
 Palestine
-
 Panama
-
 Papua New Guinea
-
 Paraguay
-
 Peru
-
 Philippines
-
 Poland
-
 Portugal
-
 Puerto Rico
-
 Qatar
-
 Reunion
-
 Romania
-
 Rwanda
-
 Saudi Arabia
-
 Serbia
-
 Singapore
-
 Slovakia
-
 Slovenia
-
 Somalia
-
 South Africa
-
 Spain
-
 Sri Lanka
-
 Sweden
-
 Switzerland
-
 Syria
-
 Taiwan
-
 Tajikistan
-
 Tanzania
-
 Thailand
-
 Trinidad and Tobago
-
 Tunisia
-
 Turkey
-
 UAE
-
 Uganda
-
 Ukraine
-
 United Kingdom
-
United States
-
 Uruguay
-
 Uzbekistan
-
 Venezuela
-
 Vietnam
-
 Yemen
-
 Zambia
-
 Zimbabwe
- Forex
- Crypto












