

Suncor Energy posts record Q3 results and dividend raise: SU consolidates near C$97.1 resistance

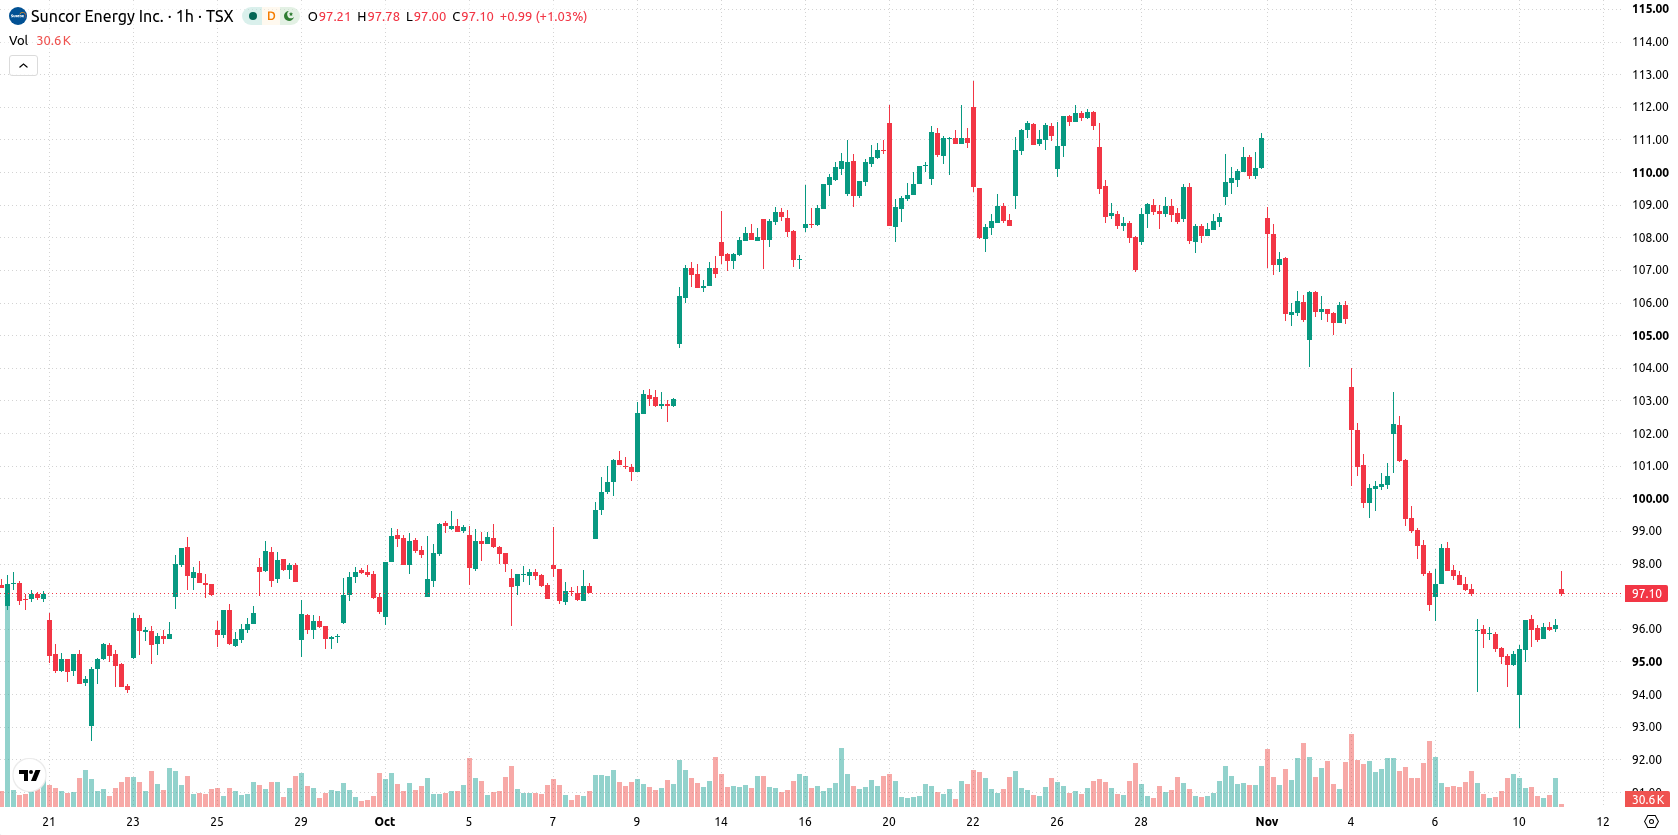
Suncor Energy (SU) stock is trading at C$97.04, up 0.98% on the day. The price is above its key short-term average but remains below intermediate trends, and it holds well above the long-term average over the past several months.
 99.76
99.76
Highlights
- Suncor Energy reported record third-quarter adjusted funds from operations of $6.7 billion and free funds flow of $5.2 billion.
- Suncor increased its dividend by 10% and raised monthly buybacks to CAD 750 million, expanding capital returns to shareholders.
- Shares of Suncor are expected to trade in the C$92.5 to C$101.58 range, with momentum indicators suggesting a higher probability of a near-term decline.
Record cash flow and buybacks strengthen investor appeal as payouts rise
Suncor Energy has reported record third-quarter adjusted funds from operations of $6.7 billion and free funds flow of $5.2 billion, marking a period of robust operational performance and increased internal cash generation, according to Themarketsdaily. This has enabled the company to boost direct shareholder returns by raising its dividend by 10%, a move that makes the stock more attractive for income-focused investors. Additionally, Suncor's decision to raise monthly share buybacks to CAD 750 million, beginning in October, points to an ongoing policy of capital return and suggests management's confidence in the company's valuation.
Mixed technical signals as short-term resistance aligns with uncertain momentum
On the technical front, SU is above its MA-20 at C$96.28 but remains just below the MA-50 at C$100.39 on the H1 chart, while trading well above the MA-200 at C$88.97. The Ichimoku Kijun at C$97.1 forms immediate resistance. Momentum indicators send mixed signals: MACD gives a strong sell, ADX points to prevailing selling pressure, but oscillators are not fully aligned—RSI and CCI are neutral, while Stoch RSI has entered overbought territory, raising the risk of a short-term correction. Bull/Bear Power is slightly positive at 0.17, reflecting mild buyer strength for intraday moves, and the Awesome Oscillator is neutral and does not confirm trend direction.
Rangebound outlook as downside risk outweighs prospects for breakout
Looking ahead, SU is likely to trade in a C$92.5 to C$101.58 volatility band over the coming days. The forecast assigns a 25% likelihood to a breakout upward, while probabilities favor a further decline at 75%. The prevailing scenario is for the price to consolidate within a sideways range. Sustained bullish momentum would require a clear move above C$97.1, whereas a break below C$92.5 would open the path to additional downside.
Earlier, analysts noted that despite Suncor Energy's strong financial performance and increased shareholder returns, the stock continued to face near-term technical pressure and heightened downside risk. The latest data reinforce this cautious outlook, with a sideways consolidation now dominant and traders advised to watch for a decisive break above C$97.1 or below C$92.5 as the next catalyst.






Latest Suncor Energy News



-
 Afghanistan
-
 Albania
-
 Algeria
-
 Angola
-
 Argentina
-
 Armenia
-
 Australia
-
 Austria
-
 Azerbaijan
-
 Bahamas
-
 Bahrain
-
 Bangladesh
-
 Belarus
-
 Belgium
-
 Bolivia
-
 Botswana
-
 Brazil
-
 Brunei
-
 Bulgaria
-
 Cambodia
-
 Cameroon
-
 Canada
-
 Chile
-
 China
-
 Colombia
-
 Congo
-
 Costa Rica
-
 Cote d'Ivoire
-
 Croatia
-
 Cuba
-
 Cyprus
-
 Czechia
-
 DR Congo
-
 Denmark
-
 Dominican Republic
-
 Ecuador
-
 Egypt
-
 El Salvador
-
 Estonia
-
 Eswatini
-
 Ethiopia
-
 Finland
-
 France
-
 Georgia
-
 Germany
-
 Ghana
-
 Greece
-
 Haiti
-
 Hong Kong
-
 Hungary
-
 India
-
 Indonesia
-
 Iran, Islamic republic
-
 Iraq
-
 Ireland
-
 Israel
-
 Italy
-
 Jamaica
-
 Japan
-
 Jordan
-
 Kazakhstan
-
 Kenya
-
 Korea
-
 Kuwait
-
 Kyrgyzstan
-
 Laos
-
 Latvia
-
 Lebanon
-
 Lesotho
-
 Libya
-
 Lithuania
-
 Luxembourg
-
 Madagascar
-
 Malaysia
-
 Malta
-
 Mauritius
-
 Mexico
-
 Moldova
-
 Mongolia
-
 Montenegro
-
 Morocco
-
 Mozambique
-
 Myanmar
-
 Namibia
-
 Nepal
-
 Netherlands
-
 New Zealand
-
 Nigeria
-
 North Macedonia
-
 Norway
-
 Oman
-
 Pakistan
-
 Palestine
-
 Panama
-
 Papua New Guinea
-
 Paraguay
-
 Peru
-
 Philippines
-
 Poland
-
 Portugal
-
 Puerto Rico
-
 Qatar
-
 Reunion
-
 Romania
-
 Rwanda
-
 Saudi Arabia
-
 Serbia
-
 Singapore
-
 Slovakia
-
 Slovenia
-
 Somalia
-
 South Africa
-
 Spain
-
 Sri Lanka
-
 Sweden
-
 Switzerland
-
 Syria
-
 Taiwan
-
 Tajikistan
-
 Tanzania
-
 Thailand
-
 Trinidad and Tobago
-
 Tunisia
-
 Turkey
-
 UAE
-
 Uganda
-
 Ukraine
-
 United Kingdom
-
United States
-
 Uruguay
-
 Uzbekistan
-
 Venezuela
-
 Vietnam
-
 Yemen
-
 Zambia
-
 Zimbabwe
- Forex
- Crypto












