

What's behind Hain Celestial's latest 7.5% stock pullback?

The Hain Celestial Group (HAIN) sank 7.48% as persistent technical selling pressure drove the shares to new lows. The decline is firmly supported by Hain Celestial trending below all major moving averages, with sellers maintaining control across all time frames.
 0.1355
0.1618
Highlights
- Hain Celestial stock remains below key short and long-term moving averages, confirming sustained pressure from sellers.
- Momentum and trend indicators register deep oversold readings, with persistent downside momentum and negative bull-bear power.
- The expected 5-day price range is $0.17 to $0.26, with support at $0.21 and only a 21% chance of a rebound above $0.22.
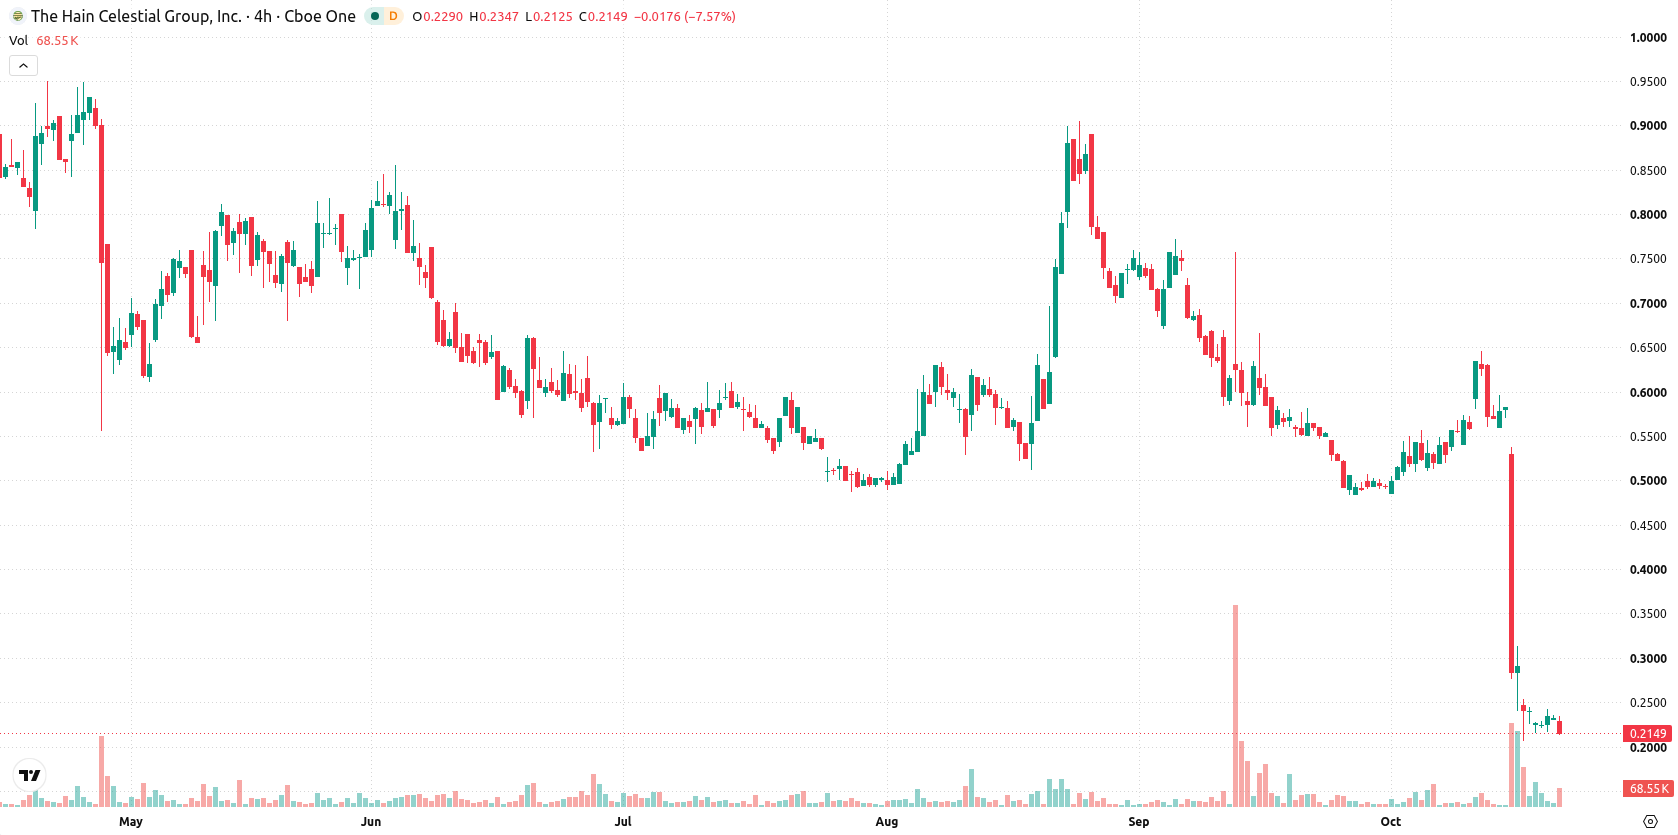
Bearish momentum as moving averages and indicators confirm weakness
Hain Celestial continues to trend below the 20-day, 50-day, and 200-day moving averages at $0.48, $0.59, and $0.73, respectively, signaling sustained pressure from sellers across all time frames. The near-term ceiling is set at $0.22, with support at the week low of $0.21, and the medium- and long-term trend remains bearish according to the MA-50 versus MA-200 alignment. Momentum readings confirm ongoing weakness, with both the MACD and ADX in sell territory. The RSI, Stochastic RSI, and CCI are all in deep oversold positions. Bull/Bear Power remains negative, pointing to dominant seller control, while the BBP’s oversold signal and the Awesome Oscillator both reinforce persistent downside momentum.
Earlier, analysts noted that Hain Celestial was persistently pressured by bearish technical signals and seller dominance across key time frames. The latest decline not only supports this previous bearish outlook but highlights $0.21 as a pivotal support level whose breakdown could trigger further downside toward $0.17.






Latest The Hain Celestial Group News




-
 Afghanistan
-
 Albania
-
 Algeria
-
 Angola
-
 Argentina
-
 Armenia
-
 Australia
-
 Austria
-
 Azerbaijan
-
 Bahamas
-
 Bahrain
-
 Bangladesh
-
 Belarus
-
 Belgium
-
 Bolivia
-
 Botswana
-
 Brazil
-
 Brunei
-
 Bulgaria
-
 Cambodia
-
 Cameroon
-
 Canada
-
 Chile
-
 China
-
 Colombia
-
 Congo
-
 Costa Rica
-
 Cote d'Ivoire
-
 Croatia
-
 Cuba
-
 Cyprus
-
 Czechia
-
 DR Congo
-
 Denmark
-
 Dominican Republic
-
 Ecuador
-
 Egypt
-
 El Salvador
-
 Estonia
-
 Eswatini
-
 Ethiopia
-
 Finland
-
 France
-
 Georgia
-
 Germany
-
 Ghana
-
 Greece
-
 Haiti
-
 Hong Kong
-
 Hungary
-
 India
-
 Indonesia
-
 Iran, Islamic republic
-
 Iraq
-
 Ireland
-
 Israel
-
 Italy
-
 Jamaica
-
 Japan
-
 Jordan
-
 Kazakhstan
-
 Kenya
-
 Korea
-
 Kuwait
-
 Kyrgyzstan
-
 Laos
-
 Latvia
-
 Lebanon
-
 Lesotho
-
 Libya
-
 Lithuania
-
 Luxembourg
-
 Madagascar
-
 Malaysia
-
 Malta
-
 Mauritius
-
 Mexico
-
 Moldova
-
 Mongolia
-
 Montenegro
-
 Morocco
-
 Mozambique
-
 Myanmar
-
 Namibia
-
 Nepal
-
 Netherlands
-
 New Zealand
-
 Nigeria
-
 North Macedonia
-
 Norway
-
 Oman
-
 Pakistan
-
 Palestine
-
 Panama
-
 Papua New Guinea
-
 Paraguay
-
 Peru
-
 Philippines
-
 Poland
-
 Portugal
-
 Puerto Rico
-
 Qatar
-
 Reunion
-
 Romania
-
 Rwanda
-
 Saudi Arabia
-
 Serbia
-
 Singapore
-
 Slovakia
-
 Slovenia
-
 Somalia
-
 South Africa
-
 Spain
-
 Sri Lanka
-
 Sweden
-
 Switzerland
-
 Syria
-
 Taiwan
-
 Tajikistan
-
 Tanzania
-
 Thailand
-
 Trinidad and Tobago
-
 Tunisia
-
 Turkey
-
 UAE
-
 Uganda
-
 Ukraine
-
 United Kingdom
-
United States
-
 Uruguay
-
 Uzbekistan
-
 Venezuela
-
 Vietnam
-
 Yemen
-
 Zambia
-
 Zimbabwe
- Forex
- Crypto












