

HSBC stock holds the 200-day moving average amid mixed technical signals

HSBC Holdings PLC (HSBA) stock is trading at GBX1,397, registering a modest daily gain and ending the session near its intraday high. The share price currently sits above its key short-term average while still lagging the intermediate-term average, exhibiting firm action in a moderately volatile session.
 1292.40
1373.00
Highlights
- HSBC Holdings stock draws increased trading volume and investor attention before its third-quarter 2026 earnings report on October 27.
- Market participants are seeking early exposure to potential changes in HSBC's outlook or profitability measures ahead of the announcement.
- Shares of HSBC trade in a sideways range of GBX1,366 to GBX1,427, with technical indicators offering mixed signals and stronger probability of downside movement.
Investor repositioning grows ahead of third-quarter earnings announcement
HSBC Holdings PLC is set to report its third-quarter 2026 earnings on October 27, an event that prompts investors to reassess their positioning ahead of the scheduled announcement, according to Investing.com. The forthcoming release is drawing greater market attention as participants seek early exposure to potential revisions in the bank’s outlook or profitability measures. This pre-earnings anticipation is influencing trading activity and sentiment as the date approaches.
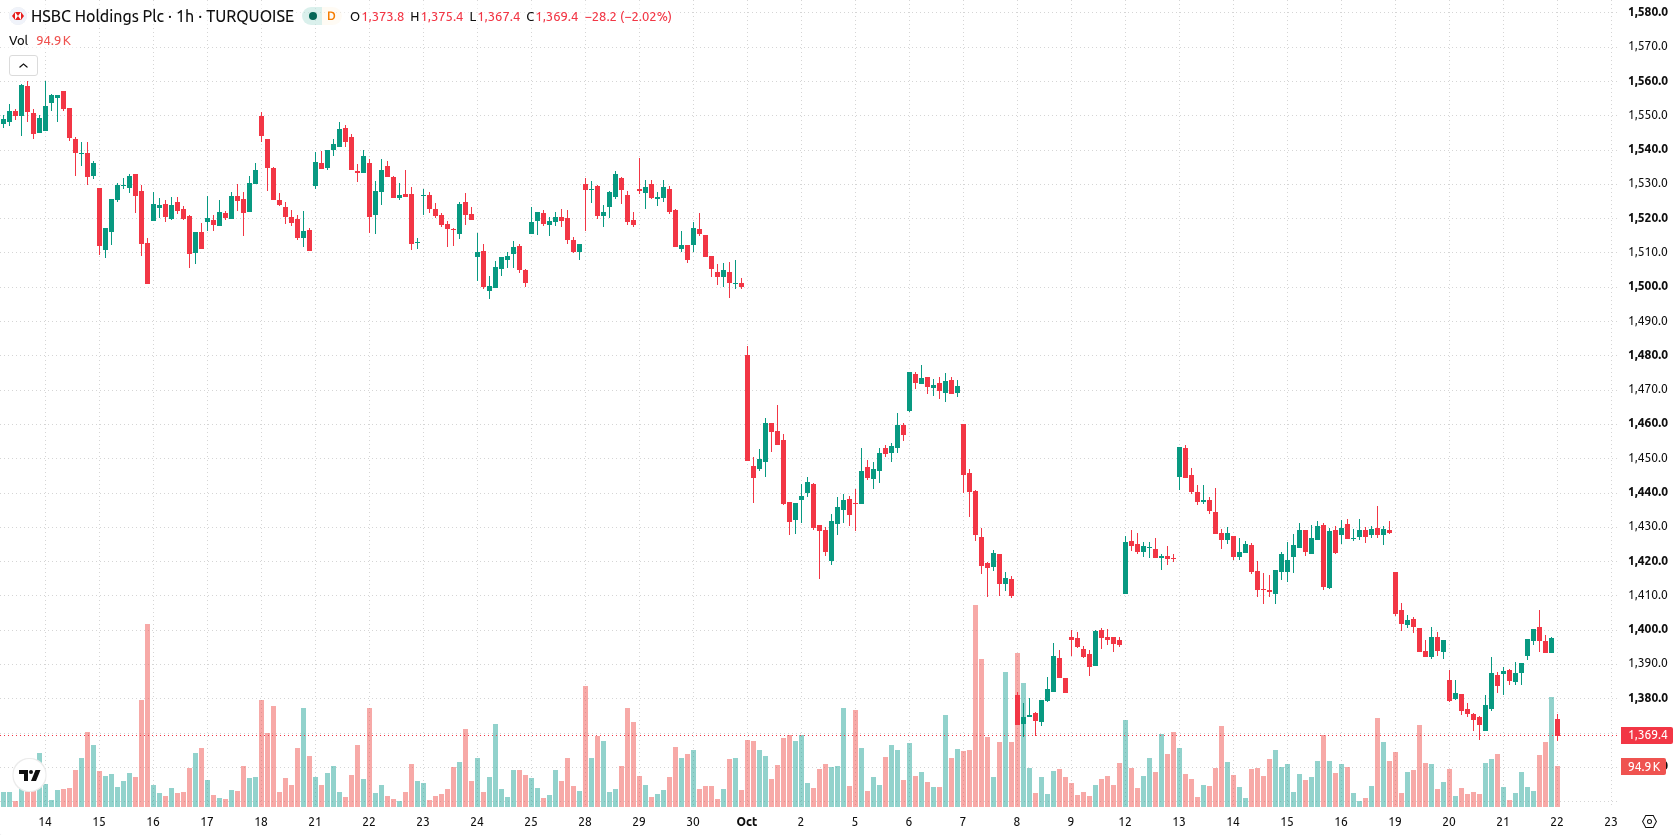
Mixed technical momentum as support holds but key signals diverge
On the chart, HSBA closed above the MA-20 but remains capped below the MA-50, while maintaining a clear position above the MA-200. The Ichimoku Kijun at GBX1,392 establishes near-term technical support. In terms of oscillators, RSI is at 52.06 and CCI is signaling buy, while both Stochastic RSI and Bull/Bear Power suggest overbought conditions amid strong buying pressure. ADX indicates a buy, but MACD delivers a strong sell signal and the Awesome Oscillator holds neutral, reflecting a notably mixed technical landscape.
Sideways bias sets outlook as downside risk marginally outweighs breakout
Over the short term, the price range for HSBA is expected to remain within GBX1,366 to GBX1,427, representing the typical volatility band relative to current levels. The probability of a downside move exceeds that of a further advance, with the baseline scenario favoring sideways price action inside this corridor. A sustained break above resistance could shift momentum toward a bullish breakout, while any slide below immediate support would reinforce negative pressure.
Earlier, analysts noted that HSBC's technical setup was dominated by bearish momentum and operational uncertainty ahead of key board decisions. The current analysis underscores a more balanced but mixed technical picture before the upcoming earnings, with traders advised to watch for a potential breakout if the price clears intermediate resistance.






Latest HSBC News





-
 Afghanistan
-
 Albania
-
 Algeria
-
 Angola
-
 Argentina
-
 Armenia
-
 Australia
-
 Austria
-
 Azerbaijan
-
 Bahamas
-
 Bahrain
-
 Bangladesh
-
 Belarus
-
 Belgium
-
 Bolivia
-
 Botswana
-
 Brazil
-
 Brunei
-
 Bulgaria
-
 Cambodia
-
 Cameroon
-
 Canada
-
 Chile
-
 China
-
 Colombia
-
 Congo
-
 Costa Rica
-
 Cote d'Ivoire
-
 Croatia
-
 Cuba
-
 Cyprus
-
 Czechia
-
 DR Congo
-
 Denmark
-
 Dominican Republic
-
 Ecuador
-
 Egypt
-
 El Salvador
-
 Estonia
-
 Eswatini
-
 Ethiopia
-
 Finland
-
 France
-
 Georgia
-
 Germany
-
 Ghana
-
 Greece
-
 Haiti
-
 Hong Kong
-
 Hungary
-
 India
-
 Indonesia
-
 Iran, Islamic republic
-
 Iraq
-
 Ireland
-
 Israel
-
 Italy
-
 Jamaica
-
 Japan
-
 Jordan
-
 Kazakhstan
-
 Kenya
-
 Korea
-
 Kuwait
-
 Kyrgyzstan
-
 Laos
-
 Latvia
-
 Lebanon
-
 Lesotho
-
 Libya
-
 Lithuania
-
 Luxembourg
-
 Madagascar
-
 Malaysia
-
 Malta
-
 Mauritius
-
 Mexico
-
 Moldova
-
 Mongolia
-
 Montenegro
-
 Morocco
-
 Mozambique
-
 Myanmar
-
 Namibia
-
 Nepal
-
 Netherlands
-
 New Zealand
-
 Nigeria
-
 North Macedonia
-
 Norway
-
 Oman
-
 Pakistan
-
 Palestine
-
 Panama
-
 Papua New Guinea
-
 Paraguay
-
 Peru
-
 Philippines
-
 Poland
-
 Portugal
-
 Puerto Rico
-
 Qatar
-
 Reunion
-
 Romania
-
 Rwanda
-
 Saudi Arabia
-
 Serbia
-
 Singapore
-
 Slovakia
-
 Slovenia
-
 Somalia
-
 South Africa
-
 Spain
-
 Sri Lanka
-
 Sweden
-
 Switzerland
-
 Syria
-
 Taiwan
-
 Tajikistan
-
 Tanzania
-
 Thailand
-
 Trinidad and Tobago
-
 Tunisia
-
 Turkey
-
 UAE
-
 Uganda
-
 Ukraine
-
 United Kingdom
-
United States
-
 Uruguay
-
 Uzbekistan
-
 Venezuela
-
 Vietnam
-
 Yemen
-
 Zambia
-
 Zimbabwe
- Forex
- Crypto












