

GSK plc receives US approval for Jemperli and reports positive R&D update: Can GSK regain momentum?

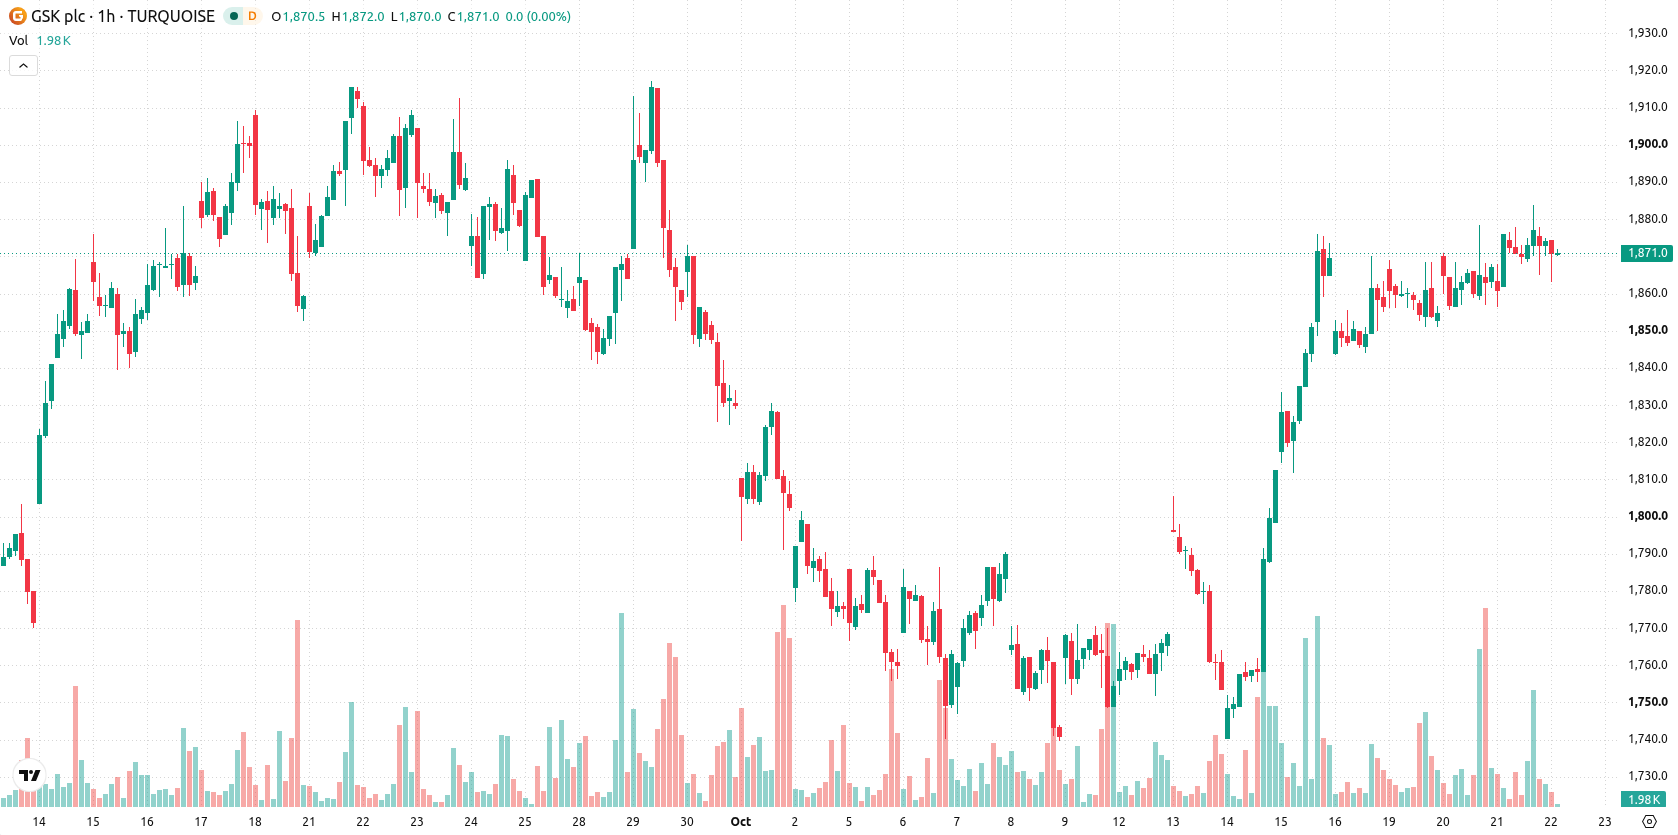
GSK (GSK) stock is trading at GBX1,873 after a modest pullback in today’s session. The price remains above its short- and medium-term moving averages while holding below longer-term trend markers.
 1890.00
1913.50
Highlights
- GSK received US accelerated approval for Jemperli in a subset of rectal cancer, immediately increasing its reach in the US oncology market.
- GSK reported positive early-stage data for its Ris-Rez therapy in small cell lung cancer, expanding the oncology pipeline and future growth prospects.
- Shares of GSK are trading in a short- to medium-term uptrend with strong buyer activity, projected to move within the GBX1,855 to GBX1,890 range over several days.
Regulatory milestones and trial results drive expanding US oncology strategy
GSK received US accelerated approval for its oncology drug Jemperli for a select group of rectal cancer patients, a development that immediately expands the company’s commercial presence in the US oncology market, according to Kalkinemedia. This regulatory milestone enables GSK to access additional patient populations and may provide new revenue streams from the therapy’s introduction. Alongside this, GSK reported positive early-stage data for its Ris-Rez therapy in small cell lung cancer, which broadens its R&D pipeline and adds to the long-term growth narrative for its oncology business.
Mixed momentum signals as price hovers between key technical levels
On the technical front, GSK is trading above its MA-20 and MA-50 on the H1 chart, while remaining below the long-term MA-200 at GBX1,951. The Ichimoku Kijun line at GBX1,867 serves as immediate support. Momentum indicators present a mixed picture: MACD and ADX are supportive of further gains, while RSI is moderately bullish. Stoch RSI currently signals an oversold condition, CCI holds neutral, and Bull/Bear Power shows buyer dominance intraday. The Awesome Oscillator does not confirm the prevailing trend.
Sideways scenario dominates as rangebound trading contains near-term outlook
In the short term, GSK is expected to remain within a trading range of GBX1,855 to GBX1,890 over the coming sessions, consistent with typical volatility at current levels. The probability of an upward move is estimated at 67%, while downside risk accounts for 33%. The base case calls for sideways price action, but a move above GBX1,890 would signal renewed bullish momentum, whereas loss of support at GBX1,855 may open the path for further declines.
Earlier, analysts noted that GSK stock was consolidating within a defined range, supported by mixed technical momentum and recent regulatory developments. The current article adds new regulatory approvals and positive R&D updates to the outlook, highlighting GBX1,890 as a key level to watch for any renewed upside momentum.






Latest GSK News



-
 Afghanistan
-
 Albania
-
 Algeria
-
 Angola
-
 Argentina
-
 Armenia
-
 Australia
-
 Austria
-
 Azerbaijan
-
 Bahamas
-
 Bahrain
-
 Bangladesh
-
 Belarus
-
 Belgium
-
 Bolivia
-
 Botswana
-
 Brazil
-
 Brunei
-
 Bulgaria
-
 Cambodia
-
 Cameroon
-
 Canada
-
 Chile
-
 China
-
 Colombia
-
 Congo
-
 Costa Rica
-
 Cote d'Ivoire
-
 Croatia
-
 Cuba
-
 Cyprus
-
 Czechia
-
 DR Congo
-
 Denmark
-
 Dominican Republic
-
 Ecuador
-
 Egypt
-
 El Salvador
-
 Estonia
-
 Eswatini
-
 Ethiopia
-
 Finland
-
 France
-
 Georgia
-
 Germany
-
 Ghana
-
 Greece
-
 Haiti
-
 Hong Kong
-
 Hungary
-
 India
-
 Indonesia
-
 Iran, Islamic republic
-
 Iraq
-
 Ireland
-
 Israel
-
 Italy
-
 Jamaica
-
 Japan
-
 Jordan
-
 Kazakhstan
-
 Kenya
-
 Korea
-
 Kuwait
-
 Kyrgyzstan
-
 Laos
-
 Latvia
-
 Lebanon
-
 Lesotho
-
 Libya
-
 Lithuania
-
 Luxembourg
-
 Madagascar
-
 Malaysia
-
 Malta
-
 Mauritius
-
 Mexico
-
 Moldova
-
 Mongolia
-
 Montenegro
-
 Morocco
-
 Mozambique
-
 Myanmar
-
 Namibia
-
 Nepal
-
 Netherlands
-
 New Zealand
-
 Nigeria
-
 North Macedonia
-
 Norway
-
 Oman
-
 Pakistan
-
 Palestine
-
 Panama
-
 Papua New Guinea
-
 Paraguay
-
 Peru
-
 Philippines
-
 Poland
-
 Portugal
-
 Puerto Rico
-
 Qatar
-
 Reunion
-
 Romania
-
 Rwanda
-
 Saudi Arabia
-
 Serbia
-
 Singapore
-
 Slovakia
-
 Slovenia
-
 Somalia
-
 South Africa
-
 Spain
-
 Sri Lanka
-
 Sweden
-
 Switzerland
-
 Syria
-
 Taiwan
-
 Tajikistan
-
 Tanzania
-
 Thailand
-
 Trinidad and Tobago
-
 Tunisia
-
 Turkey
-
 UAE
-
 Uganda
-
 Ukraine
-
 United Kingdom
-
United States
-
 Uruguay
-
 Uzbekistan
-
 Venezuela
-
 Vietnam
-
 Yemen
-
 Zambia
-
 Zimbabwe
- Forex
- Crypto












