

GSK shares fall over 2% as intraday selling pressures and fading momentum weigh on price

GSK plc (GSK) fell 2.01% as intraday selling pressured the shares, with buyers unable to sustain early gains amid cautious sentiment and fading momentum. The move is limited by the stock holding above its 20- and 50-day moving averages at GBX1,848 and GBX1,841, while remaining below the longer-term 200-day moving average at GBX1,952.
 1944.00
1915.50
Highlights
- Shares of GSK trade above short- and medium-term moving averages but remain under longer-term technical resistance.
- Intraday volatility is elevated at 2.08%, with the stock recently down 2.01% from the previous close and session gains faded toward lows.
- Technical indicators show near-term bullish momentum with a projected five-day range of GBX1,795 to GBX1,911 and over 80% probability of an upward move.
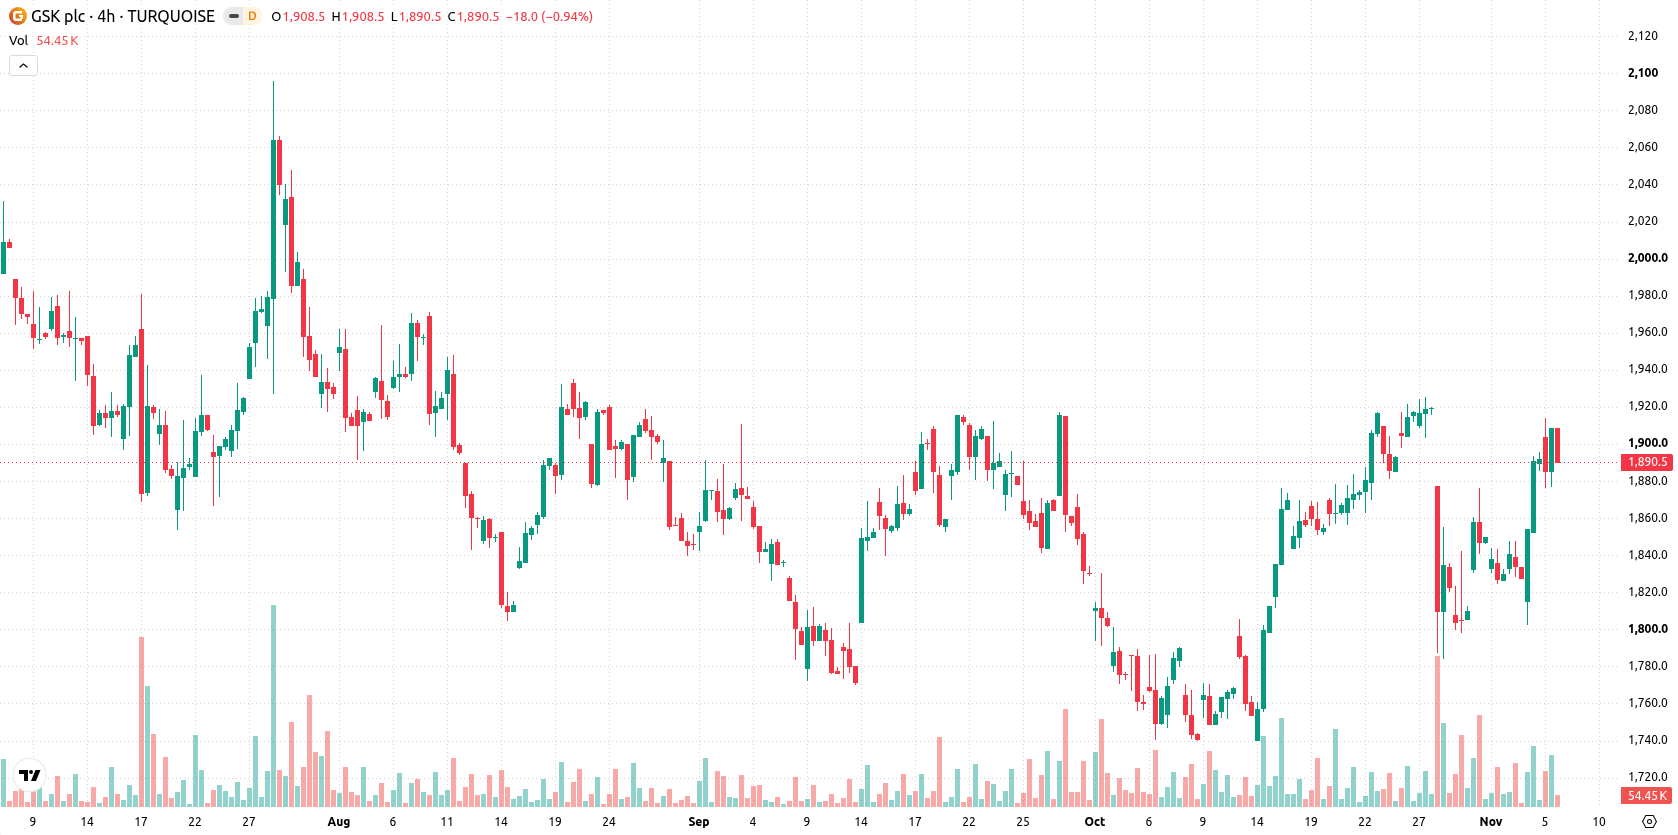
Short-term bullish signals conflict with 200-day resistance and mixed momentum
GSK is trading above its 20-day and 50-day moving averages at GBX1,848 and GBX1,841, respectively, but remains below its 200-day moving average at GBX1,952, indicating bullish momentum in the short and medium term with persistent longer-term resistance. Immediate upside is capped by resistance at GBX1,876, while support levels are seen at GBX1,848 and at the Ichimoku Kijun near GBX1,832. Momentum indicators present an overall bullish tone: MACD signals buy momentum, the Average Directional Index (ADX) is neutral, and the RSI, Stochastic RSI, and Commodity Channel Index (CCI) remain in neutral zones. Positive Bull/Bear Power (BBP) and a strong signal from the Awesome Oscillator show buyers are dominant intraday, despite the stock closing near session lows with volatility amplitude at 2.08%.
Earlier, analysts noted that GSK demonstrated near-term technical strength while facing longer-term resistance. The current analysis adds that traders should monitor the GBX1,876 resistance area closely, as a sustained breakout above this level would shift risk profiles and open the way for further upside within the projected trading band.










-
 Afghanistan
-
 Albania
-
 Algeria
-
 Angola
-
 Argentina
-
 Armenia
-
 Australia
-
 Austria
-
 Azerbaijan
-
 Bahamas
-
 Bahrain
-
 Bangladesh
-
 Belarus
-
 Belgium
-
 Bolivia
-
 Botswana
-
 Brazil
-
 Brunei
-
 Bulgaria
-
 Cambodia
-
 Cameroon
-
 Canada
-
 Chile
-
 China
-
 Colombia
-
 Congo
-
 Costa Rica
-
 Cote d'Ivoire
-
 Croatia
-
 Cuba
-
 Cyprus
-
 Czechia
-
 DR Congo
-
 Denmark
-
 Dominican Republic
-
 Ecuador
-
 Egypt
-
 El Salvador
-
 Estonia
-
 Eswatini
-
 Ethiopia
-
 Finland
-
 France
-
 Georgia
-
 Germany
-
 Ghana
-
 Greece
-
 Haiti
-
 Hong Kong
-
 Hungary
-
 India
-
 Indonesia
-
 Iran, Islamic republic
-
 Iraq
-
 Ireland
-
 Israel
-
 Italy
-
 Jamaica
-
 Japan
-
 Jordan
-
 Kazakhstan
-
 Kenya
-
 Korea
-
 Kuwait
-
 Kyrgyzstan
-
 Laos
-
 Latvia
-
 Lebanon
-
 Lesotho
-
 Libya
-
 Lithuania
-
 Luxembourg
-
 Madagascar
-
 Malaysia
-
 Malta
-
 Mauritius
-
 Mexico
-
 Moldova
-
 Mongolia
-
 Montenegro
-
 Morocco
-
 Mozambique
-
 Myanmar
-
 Namibia
-
 Nepal
-
 Netherlands
-
 New Zealand
-
 Nigeria
-
 North Macedonia
-
 Norway
-
 Oman
-
 Pakistan
-
 Palestine
-
 Panama
-
 Papua New Guinea
-
 Paraguay
-
 Peru
-
 Philippines
-
 Poland
-
 Portugal
-
 Puerto Rico
-
 Qatar
-
 Reunion
-
 Romania
-
 Rwanda
-
 Saudi Arabia
-
 Serbia
-
 Singapore
-
 Slovakia
-
 Slovenia
-
 Somalia
-
 South Africa
-
 Spain
-
 Sri Lanka
-
 Sweden
-
 Switzerland
-
 Syria
-
 Taiwan
-
 Tajikistan
-
 Tanzania
-
 Thailand
-
 Trinidad and Tobago
-
 Tunisia
-
 Turkey
-
 UAE
-
 Uganda
-
 Ukraine
-
 United Kingdom
-
United States
-
 Uruguay
-
 Uzbekistan
-
 Venezuela
-
 Vietnam
-
 Yemen
-
 Zambia
-
 Zimbabwe
- Forex
- Crypto












