

GSK trades flat as buyer support persists in a mixed technical setup

GSK (GSK) stock is trading at GBX1,892.50 with a slight gain for the session. The price currently sits above its key short- and medium-term moving averages, suggesting near-term strength relative to recent trends.
 1890.00
1913.50
Highlights
- GSK Pharma reported a standalone Q2 profit increase of 31% to Rs 334.62 crore with 21% revenue growth.
- Cash reserves reached Rs 650.19 crore at period end, receiving Rs 42.09 crore in tax refund interest and Rs 18 crore as subsidiary dividend.
- Shares of GSK/GBX are forecast to trade within GBX1,851 to GBX1,935 over 2 to 3 days, with overbought technicals suggesting possible short-term correction risk.
Profit surge and tax refund reinforce financial strength
GSK Pharma reported a 31% increase in standalone Q2 profit to Rs 334.62 crore, reflecting stronger operational performance and boosting distributable income. Revenue growth of 21% signals improved commercial momentum, likely enhancing future cash flows, while the company also received Rs 42.09 crore in tax-refund interest, bolstering short-term liquidity. Additional support came from a Rs 18 crore dividend from its wholly owned subsidiary, substantial dividend distributions totaling Rs 969.93 crore to shareholders, and robust cash reserves of Rs 650.19 crore at period end, all reinforcing the company's financial resilience in the current environment.
Mixed momentum as price nears long-term resistance
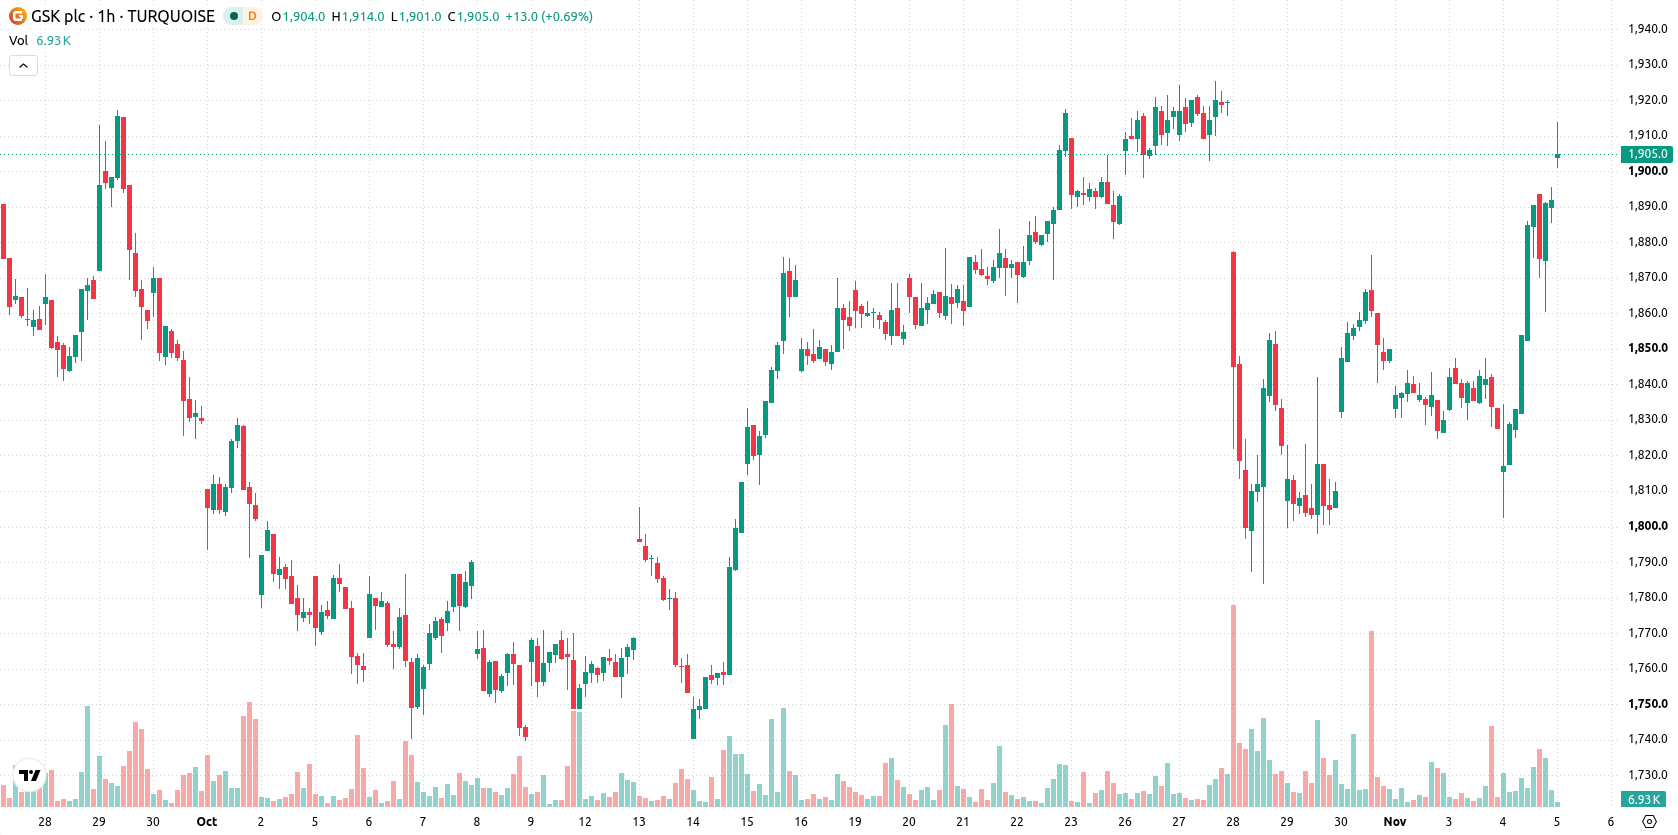
On the hourly chart, GSK trades above the MA-20 at GBX1,848 and the MA-50 at GBX1,839, highlighting current price support in both short- and medium-term timeframes. However, the price remains below the MA-200 from the daily timeframe at GBX1,952, which suggests the presence of long-term resistance ahead, while the Ichimoku Kijun at GBX1,848 forms a nearby support level. Momentum readings present a mixed technical picture: MACD has produced a Buy signal and Bull/Bear Power stands positive at 31.63, indicating prevailing buyer dominance, while ADX and RSI both register at neutral. Stochastic RSI and CCI remain in overbought territory, cautioning that a short-term correction could be possible, even amid high intraday volatility and strong recovery from today’s opening gap. Awesome Oscillator output continues to support an overall bullish technical bias.
Upside bias prevails amid defined short-term trading band
For the next 2–3 trading days, GSK is expected to trade within a typical volatility band between GBX1,851 and GBX1,935. Probabilistic modeling suggests a 73% chance of prices moving higher within this corridor, with only a 27% likelihood of a downside break. The baseline scenario anticipates oscillation inside these levels, though a decisive move above resistance could open the way for further upside, while a drop below immediate support might trigger a bearish reversal.
Earlier, analysts noted that GSK demonstrated short- and medium-term technical strength, while facing longer-term resistance and mixed momentum signals. The latest financial outperformance and ongoing technical recovery bolster this view, but traders should monitor the GBX1,952 level as a critical resistance point for signs of a sustained upward breakout or potential reversal.






Latest GSK News




-
 Afghanistan
-
 Albania
-
 Algeria
-
 Angola
-
 Argentina
-
 Armenia
-
 Australia
-
 Austria
-
 Azerbaijan
-
 Bahamas
-
 Bahrain
-
 Bangladesh
-
 Belarus
-
 Belgium
-
 Bolivia
-
 Botswana
-
 Brazil
-
 Brunei
-
 Bulgaria
-
 Cambodia
-
 Cameroon
-
 Canada
-
 Chile
-
 China
-
 Colombia
-
 Congo
-
 Costa Rica
-
 Cote d'Ivoire
-
 Croatia
-
 Cuba
-
 Cyprus
-
 Czechia
-
 DR Congo
-
 Denmark
-
 Dominican Republic
-
 Ecuador
-
 Egypt
-
 El Salvador
-
 Estonia
-
 Eswatini
-
 Ethiopia
-
 Finland
-
 France
-
 Georgia
-
 Germany
-
 Ghana
-
 Greece
-
 Haiti
-
 Hong Kong
-
 Hungary
-
 India
-
 Indonesia
-
 Iran, Islamic republic
-
 Iraq
-
 Ireland
-
 Israel
-
 Italy
-
 Jamaica
-
 Japan
-
 Jordan
-
 Kazakhstan
-
 Kenya
-
 Korea
-
 Kuwait
-
 Kyrgyzstan
-
 Laos
-
 Latvia
-
 Lebanon
-
 Lesotho
-
 Libya
-
 Lithuania
-
 Luxembourg
-
 Madagascar
-
 Malaysia
-
 Malta
-
 Mauritius
-
 Mexico
-
 Moldova
-
 Mongolia
-
 Montenegro
-
 Morocco
-
 Mozambique
-
 Myanmar
-
 Namibia
-
 Nepal
-
 Netherlands
-
 New Zealand
-
 Nigeria
-
 North Macedonia
-
 Norway
-
 Oman
-
 Pakistan
-
 Palestine
-
 Panama
-
 Papua New Guinea
-
 Paraguay
-
 Peru
-
 Philippines
-
 Poland
-
 Portugal
-
 Puerto Rico
-
 Qatar
-
 Reunion
-
 Romania
-
 Rwanda
-
 Saudi Arabia
-
 Serbia
-
 Singapore
-
 Slovakia
-
 Slovenia
-
 Somalia
-
 South Africa
-
 Spain
-
 Sri Lanka
-
 Sweden
-
 Switzerland
-
 Syria
-
 Taiwan
-
 Tajikistan
-
 Tanzania
-
 Thailand
-
 Trinidad and Tobago
-
 Tunisia
-
 Turkey
-
 UAE
-
 Uganda
-
 Ukraine
-
 United Kingdom
-
United States
-
 Uruguay
-
 Uzbekistan
-
 Venezuela
-
 Vietnam
-
 Yemen
-
 Zambia
-
 Zimbabwe
- Forex
- Crypto












