

Will Reckitt Benckiser stock avoid further downside amid ongoing share buybacks?

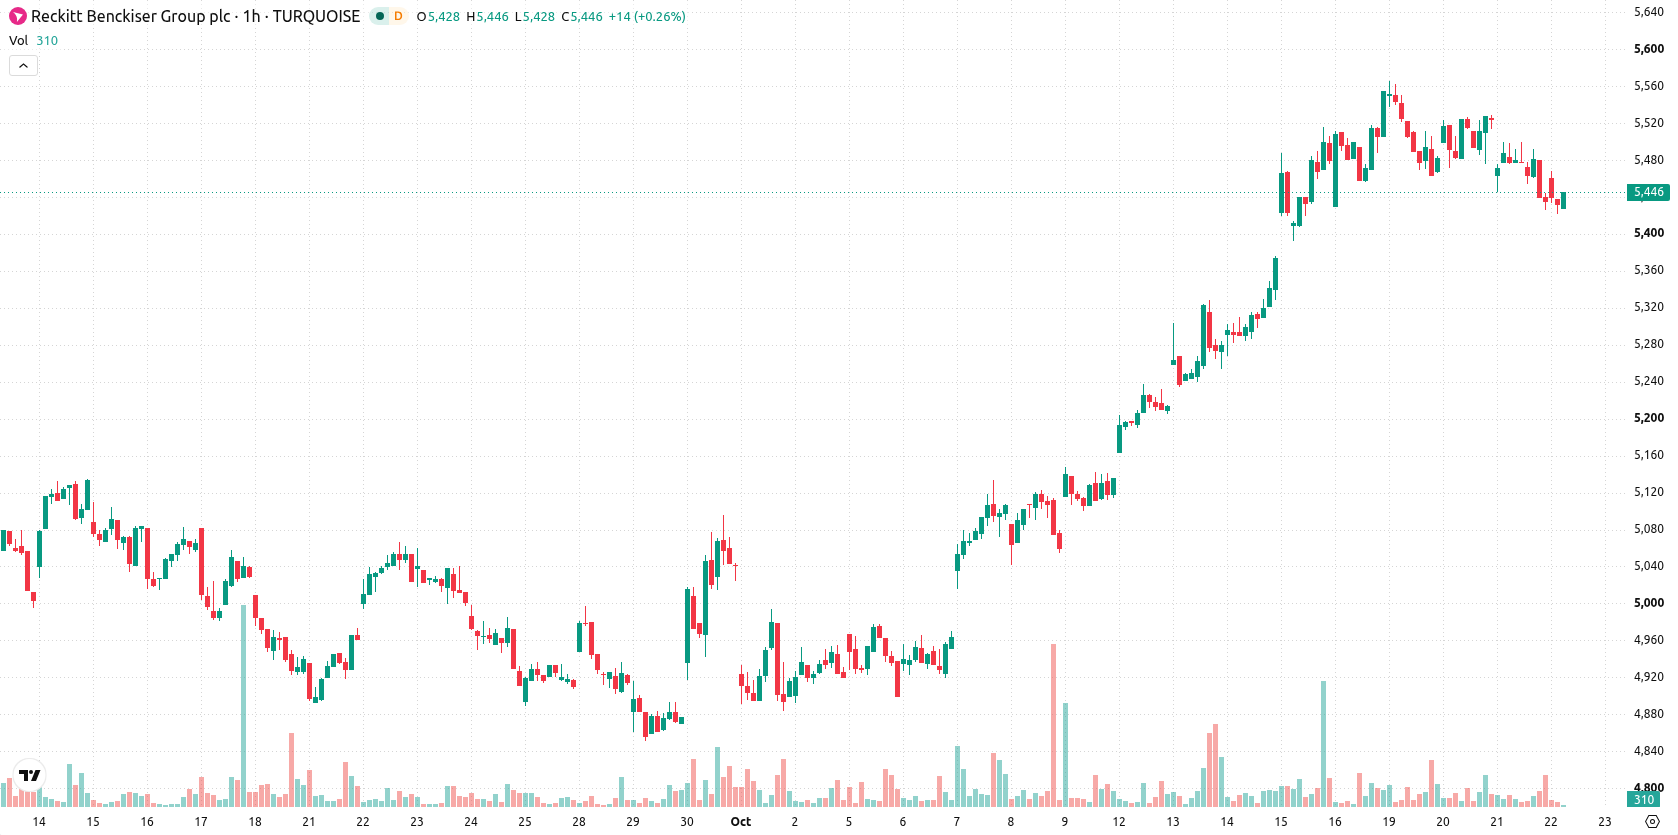
Reckitt Benckiser (RKT) stock is trading at GBX5,450 after posting a modest intraday gain. The price remains positioned below its key short- and medium-term moving averages but above longer-term supports.
 5450.00
5568.00
Highlights
- Reckitt Benckiser continued share buybacks, directly lowering outstanding shares and enhancing per-share financial figures.
- Investors await next week’s trading statement for further details on buyback progress and operational updates.
- Shares of Reckitt Benckiser face short- and medium-term bearish technical pressures, with a projected price range of GBX5,383 to GBX5,516 over the next two to three days.
Buyback activity boosts per-share metrics amid disclosure anticipation
Reckitt Benckiser has continued its program of share repurchases, as officially recorded in the latest weekly buyback notice filed on Monday, according to Kalkinemedia. This reduction in outstanding shares directly improves per-share metrics and can contribute to near-term support for the stock by increasing scarcity of available shares. Expectations for further details in next week's trading statement could also factor into trading activity as investors anticipate additional disclosures surrounding buyback progress and operational performance.
Sustained weakness signaled as technical barriers limit upside
On the hourly chart, RKT trades below the MA-20 (GBX5,484) and MA-50 (GBX5,476), with the Ichimoku Kijun at GBX5,476 offering immediate resistance. The daily MA-200 at GBX5,247 acts as major longer-term support. Hourly momentum remains weak, as the MACD flashes a Sell signal, while ADX stays Neutral, indicating no strong trend. Oscillators including RSI, Stochastic RSI, CCI, and Bull/Bear Power all signal seller dominance or are in oversold territory, and the Awesome Oscillator aligns with this bearish bias. Notably, although there was an intraday price gain and a 28-point opening gap, momentum and oscillator readings do not confirm sustained strength, and volatility remains subdued.
Downside risk persists as price remains range-bound near supports
Looking ahead to the next 2–3 trading days, the price is expected to move within a corridor between GBX5,383 and GBX5,516, reflecting typical volatility for the period. The probability of a further move lower is estimated at 60%, while the chance of an upside reversal stands at 40%. The baseline scenario envisions price action contained within this range, with a break above the immediate resistance signaling a potential bullish shift, while a drop below support would suggest extended downside.
Earlier, analysts noted that bullish technical momentum in Reckitt Benckiser was tempered by overbought conditions and the potential impact of flu trends on earnings forecasts. The current setup introduces a new factor with active share buybacks, and while near-term weakness persists, a decisive move outside the GBX5,383–GBX5,516 corridor will be crucial for the next trend direction.










-
 Afghanistan
-
 Albania
-
 Algeria
-
 Angola
-
 Argentina
-
 Armenia
-
 Australia
-
 Austria
-
 Azerbaijan
-
 Bahamas
-
 Bahrain
-
 Bangladesh
-
 Belarus
-
 Belgium
-
 Bolivia
-
 Botswana
-
 Brazil
-
 Brunei
-
 Bulgaria
-
 Cambodia
-
 Cameroon
-
 Canada
-
 Chile
-
 China
-
 Colombia
-
 Congo
-
 Costa Rica
-
 Cote d'Ivoire
-
 Croatia
-
 Cuba
-
 Cyprus
-
 Czechia
-
 DR Congo
-
 Denmark
-
 Dominican Republic
-
 Ecuador
-
 Egypt
-
 El Salvador
-
 Estonia
-
 Eswatini
-
 Ethiopia
-
 Finland
-
 France
-
 Georgia
-
 Germany
-
 Ghana
-
 Greece
-
 Haiti
-
 Hong Kong
-
 Hungary
-
 India
-
 Indonesia
-
 Iran, Islamic republic
-
 Iraq
-
 Ireland
-
 Israel
-
 Italy
-
 Jamaica
-
 Japan
-
 Jordan
-
 Kazakhstan
-
 Kenya
-
 Korea
-
 Kuwait
-
 Kyrgyzstan
-
 Laos
-
 Latvia
-
 Lebanon
-
 Lesotho
-
 Libya
-
 Lithuania
-
 Luxembourg
-
 Madagascar
-
 Malaysia
-
 Malta
-
 Mauritius
-
 Mexico
-
 Moldova
-
 Mongolia
-
 Montenegro
-
 Morocco
-
 Mozambique
-
 Myanmar
-
 Namibia
-
 Nepal
-
 Netherlands
-
 New Zealand
-
 Nigeria
-
 North Macedonia
-
 Norway
-
 Oman
-
 Pakistan
-
 Palestine
-
 Panama
-
 Papua New Guinea
-
 Paraguay
-
 Peru
-
 Philippines
-
 Poland
-
 Portugal
-
 Puerto Rico
-
 Qatar
-
 Reunion
-
 Romania
-
 Rwanda
-
 Saudi Arabia
-
 Serbia
-
 Singapore
-
 Slovakia
-
 Slovenia
-
 Somalia
-
 South Africa
-
 Spain
-
 Sri Lanka
-
 Sweden
-
 Switzerland
-
 Syria
-
 Taiwan
-
 Tajikistan
-
 Tanzania
-
 Thailand
-
 Trinidad and Tobago
-
 Tunisia
-
 Turkey
-
 UAE
-
 Uganda
-
 Ukraine
-
 United Kingdom
-
United States
-
 Uruguay
-
 Uzbekistan
-
 Venezuela
-
 Vietnam
-
 Yemen
-
 Zambia
-
 Zimbabwe
- Forex
- Crypto












