

Reckitt Benckiser transparency improves with Bangladesh PLC update: RKT faces GBX5,384 resistance

Reckitt Benckiser Group (RKT) stock is trading at GBX5,376, up 1.4% on the day. The price currently sits above its short- and long-term moving averages but remains just under intermediate resistance levels.
 5600.00
5574.00
Highlights
- Shares of Reckitt Benckiser rise as institutional buying and index-linked inflows increase demand across the FTSE 100.
- Reckitt Benckiser Bangladesh PLC releases interim financial statements for the period ending September 30, 2026, providing new subsidiary data.
- RKT trades near daily highs at GBX5,376 with bullish intraday momentum and overbought conditions; expected trading range is GBX5,170 to GBX5,581.
Institutional buying and transparency drive improved sentiment for RKT
Reckitt Benckiser's advance is supported by broader FTSE 100 opening gains, highlighting active institutional buying and index-linked inflows, according to Analyticsinsight. This positive momentum is reinforced by Reckitt Benckiser Bangladesh PLC's release of interim condensed financial statements as at and for the period ending September 30, 2026, which improve transparency and offer fresh insight into group subsidiary performance. Collectively, these developments contribute to improved sentiment and continued demand for RKT shares.
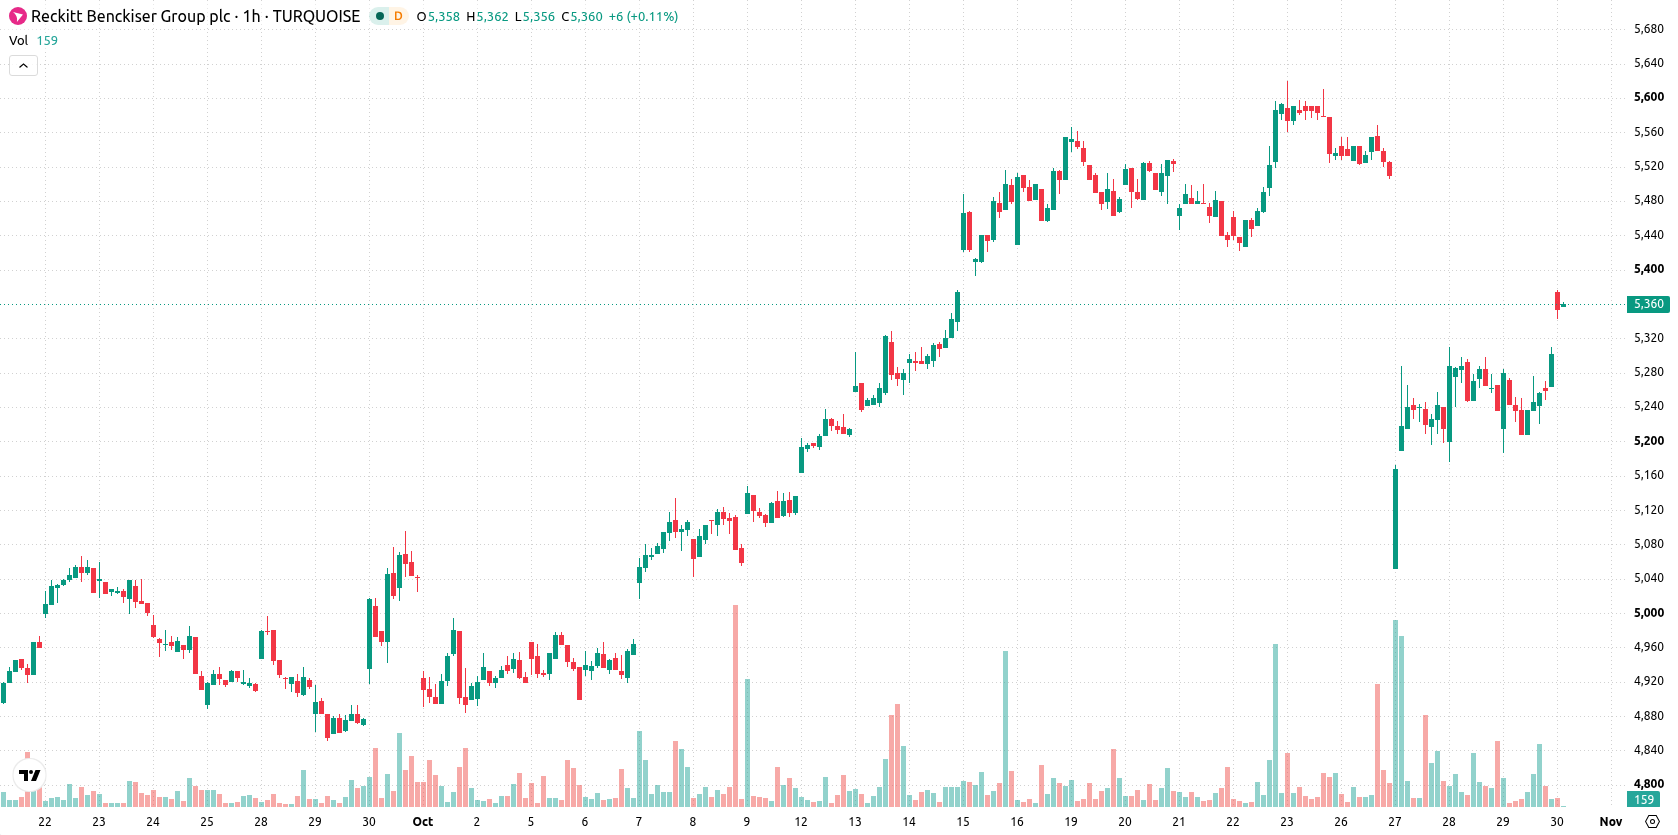
Mixed momentum signals as RKT tests resistance amid overbought conditions
Technically, RKT is trading above the MA-20 at GBX5,262 and the MA-200 at GBX5,223, while remaining just under the MA-50 resistance at GBX5,384. The Ichimoku Kijun sits at GBX5,238, marking immediate support for the current advance. Indicators show mixed momentum: MACD signals Strong Sell, offset by a Buy signal from ADX and a bullish 59.47 RSI, while Stochastic RSI, CCI, and Bull/Bear Power indicate strong intraday buying pressure and overbought conditions. The Awesome Oscillator remains neutral, leaving the short-term trend less defined. While buyers dominate currently, the divergence between the strong upward momentum and bearish MACD highlights risk of a possible pullback.
Volatility expected as outlook hinges on resistance and support levels
Over the next two to three trading days, the price is expected to fluctuate in a typical volatility band between GBX5,170 and GBX5,581. The probability of continued upward movement stands at 62%, with downside risk at 38%. The baseline scenario sees RKT contained within this range while a bullish case could unfold if resistance at the MA-50 is breached; conversely, a move below the Ichimoku Kijun at GBX5,238 would increase the likelihood of a bearish scenario.
Earlier, analysts noted that Reckitt Benckiser faced mixed technical momentum and operational headwinds, warranting a cautious outlook for sustained gains. The latest price action and subsidiary disclosures introduce fresh technical signals and enhanced transparency, making the MA-50 resistance at GBX5,384 a key level to monitor for confirmation of a continued breakout.










-
 Afghanistan
-
 Albania
-
 Algeria
-
 Angola
-
 Argentina
-
 Armenia
-
 Australia
-
 Austria
-
 Azerbaijan
-
 Bahamas
-
 Bahrain
-
 Bangladesh
-
 Belarus
-
 Belgium
-
 Bolivia
-
 Botswana
-
 Brazil
-
 Brunei
-
 Bulgaria
-
 Cambodia
-
 Cameroon
-
 Canada
-
 Chile
-
 China
-
 Colombia
-
 Congo
-
 Costa Rica
-
 Cote d'Ivoire
-
 Croatia
-
 Cuba
-
 Cyprus
-
 Czechia
-
 DR Congo
-
 Denmark
-
 Dominican Republic
-
 Ecuador
-
 Egypt
-
 El Salvador
-
 Estonia
-
 Eswatini
-
 Ethiopia
-
 Finland
-
 France
-
 Georgia
-
 Germany
-
 Ghana
-
 Greece
-
 Haiti
-
 Hong Kong
-
 Hungary
-
 India
-
 Indonesia
-
 Iran, Islamic republic
-
 Iraq
-
 Ireland
-
 Israel
-
 Italy
-
 Jamaica
-
 Japan
-
 Jordan
-
 Kazakhstan
-
 Kenya
-
 Korea
-
 Kuwait
-
 Kyrgyzstan
-
 Laos
-
 Latvia
-
 Lebanon
-
 Lesotho
-
 Libya
-
 Lithuania
-
 Luxembourg
-
 Madagascar
-
 Malaysia
-
 Malta
-
 Mauritius
-
 Mexico
-
 Moldova
-
 Mongolia
-
 Montenegro
-
 Morocco
-
 Mozambique
-
 Myanmar
-
 Namibia
-
 Nepal
-
 Netherlands
-
 New Zealand
-
 Nigeria
-
 North Macedonia
-
 Norway
-
 Oman
-
 Pakistan
-
 Palestine
-
 Panama
-
 Papua New Guinea
-
 Paraguay
-
 Peru
-
 Philippines
-
 Poland
-
 Portugal
-
 Puerto Rico
-
 Qatar
-
 Reunion
-
 Romania
-
 Rwanda
-
 Saudi Arabia
-
 Serbia
-
 Singapore
-
 Slovakia
-
 Slovenia
-
 Somalia
-
 South Africa
-
 Spain
-
 Sri Lanka
-
 Sweden
-
 Switzerland
-
 Syria
-
 Taiwan
-
 Tajikistan
-
 Tanzania
-
 Thailand
-
 Trinidad and Tobago
-
 Tunisia
-
 Turkey
-
 UAE
-
 Uganda
-
 Ukraine
-
 United Kingdom
-
United States
-
 Uruguay
-
 Uzbekistan
-
 Venezuela
-
 Vietnam
-
 Yemen
-
 Zambia
-
 Zimbabwe
- Forex
- Crypto












