

Johnson & Johnson shares contained by resistance at $265.07 as oscillators flash mixed signals: weekly analysis

Shares of Johnson & Johnson (JNJ) are trading near $263 after gaining around 3% over the past week. The chart shows recovery could continue, but conflicting technical signals and a stretched setup keep the outlook cautious into the new week.
 272.07
277.73
Highlights
- Shares of Johnson & Johnson rose $7.71 over the past week to $263.24, maintaining a bullish long-term trend.
- Price action remains in a narrow range, with volatility at 3.66% and technical indicators showing mixed signals between neutral and overbought.
- The stock is expected to consolidate between $260.74 support and $265.07 resistance, with a 56% probability of moving higher within a $259.12 to $267.35 range.
Earnings growth from MedTech offsets GAAP decline amid raised guidance
Johnson & Johnson reported its third-quarter earnings on October 17, 2026, with both revenue and earnings surpassing analyst expectations, according to Yahoo Finance and The Motley Fool. However, the company's GAAP net earnings dropped sharply by 95.9% year-over-year to $210 million, and GAAP EPS fell to $0.09 from $2.12, as reported by 24/7 Wall St. Despite the earnings decline, JNJ raised its full-year 2026 sales guidance to about $101.2 billion and increased its annual dividend for the 64th consecutive year (sources: Yahoo Finance, 24/7 Wall St.). Growth from the MedTech division and the launch of a new catheter that halves IVL procedure time are key positives this week (source: StockTitan).
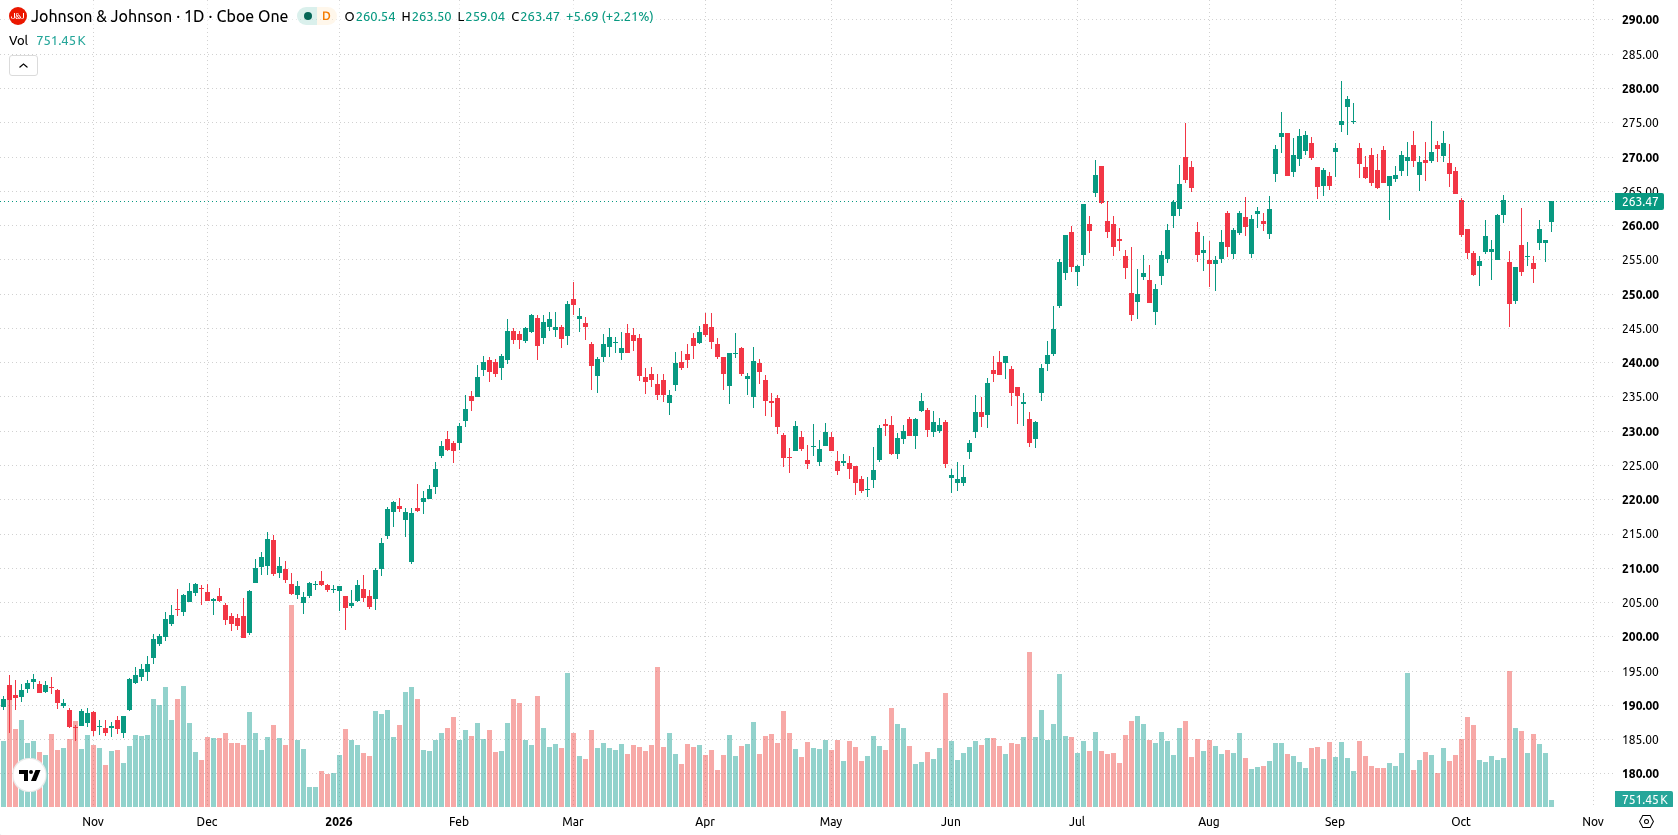
Sideways bias persists as mixed oscillators reinforce resistance and support
The daily chart reveals a contained move within a narrow range as volatility reached 3.66% over the past week. Oscillators give a mixed signal: the RSI remains neutral at 47.01 while the Stochastic RSI is overbought. Support is seen at $260.74 and the Ichimoku Kijun near $259.89, with resistance at $265.07. This setup suggests price may stay contained in the near term unless a clear breakout or breakdown occurs.
Consolidation likely as breakout risks frame next week’s scenario
For the coming trading week, the expected range is $259.12 to $267.35. The probability of an increase stands at 56%, with a 44% chance of decrease. Base case sees the stock consolidating between support at $260.74 and resistance at $265.07. A daily close above $265.07 could open a move towards the upper end of the range, while a break below $260.74 may signal a test toward $259.12.
Previously it was reported that Johnson & Johnson shares remained under pressure as the stock consolidated in an oversold technical setup amid ongoing litigation concerns and mixed momentum signals. The latest recovery above recent support introduces a potential shift toward stabilization, making sustained closes above $265.07 an important level to monitor for signs of further upside.











-
 Afghanistan
-
 Albania
-
 Algeria
-
 Angola
-
 Argentina
-
 Armenia
-
 Australia
-
 Austria
-
 Azerbaijan
-
 Bahamas
-
 Bahrain
-
 Bangladesh
-
 Belarus
-
 Belgium
-
 Bolivia
-
 Botswana
-
 Brazil
-
 Brunei
-
 Bulgaria
-
 Cambodia
-
 Cameroon
-
 Canada
-
 Chile
-
 China
-
 Colombia
-
 Congo
-
 Costa Rica
-
 Cote d'Ivoire
-
 Croatia
-
 Cuba
-
 Cyprus
-
 Czechia
-
 DR Congo
-
 Denmark
-
 Dominican Republic
-
 Ecuador
-
 Egypt
-
 El Salvador
-
 Estonia
-
 Eswatini
-
 Ethiopia
-
 Finland
-
 France
-
 Georgia
-
 Germany
-
 Ghana
-
 Greece
-
 Haiti
-
 Hong Kong
-
 Hungary
-
 India
-
 Indonesia
-
 Iran, Islamic republic
-
 Iraq
-
 Ireland
-
 Israel
-
 Italy
-
 Jamaica
-
 Japan
-
 Jordan
-
 Kazakhstan
-
 Kenya
-
 Korea
-
 Kuwait
-
 Kyrgyzstan
-
 Laos
-
 Latvia
-
 Lebanon
-
 Lesotho
-
 Libya
-
 Lithuania
-
 Luxembourg
-
 Madagascar
-
 Malaysia
-
 Malta
-
 Mauritius
-
 Mexico
-
 Moldova
-
 Mongolia
-
 Montenegro
-
 Morocco
-
 Mozambique
-
 Myanmar
-
 Namibia
-
 Nepal
-
 Netherlands
-
 New Zealand
-
 Nigeria
-
 North Macedonia
-
 Norway
-
 Oman
-
 Pakistan
-
 Palestine
-
 Panama
-
 Papua New Guinea
-
 Paraguay
-
 Peru
-
 Philippines
-
 Poland
-
 Portugal
-
 Puerto Rico
-
 Qatar
-
 Reunion
-
 Romania
-
 Rwanda
-
 Saudi Arabia
-
 Serbia
-
 Singapore
-
 Slovakia
-
 Slovenia
-
 Somalia
-
 South Africa
-
 Spain
-
 Sri Lanka
-
 Sweden
-
 Switzerland
-
 Syria
-
 Taiwan
-
 Tajikistan
-
 Tanzania
-
 Thailand
-
 Trinidad and Tobago
-
 Tunisia
-
 Turkey
-
 UAE
-
 Uganda
-
 Ukraine
-
 United Kingdom
-
United States
-
 Uruguay
-
 Uzbekistan
-
 Venezuela
-
 Vietnam
-
 Yemen
-
 Zambia
-
 Zimbabwe
- Forex
- Crypto












