

Tesla beats Q3 2026 earnings estimates but faces margin squeeze: Can TSLA regain momentum?

Tesla (TSLA) stock is trading at $386.28, posting a slight daily decline under moderate intraday volatility. The price currently sits above its key moving averages, but remains near longer-term resistance levels.
 386.75
401.16
Highlights
- Tesla stock reported non-GAAP EPS of $0.48 and revenue of $28.05 billion, exceeding analyst forecasts for the quarter.
- Operating income dropped 56% on higher spending for the Optimus robot and artificial intelligence, and potential Tesla-SpaceX merger discussions and regulatory probes added uncertainty.
- Shares of Tesla are trading with strong bullish momentum and overbought signals, expected to oscillate between $368.66 and $403.9 over the next two to three days.
Margin squeeze and merger talk raise mixed post-earnings sentiment
Tesla reported its third-quarter 2026 earnings with non-GAAP EPS of $0.48 on $28.05 billion in revenue, beating analyst estimates while operating income fell sharply by 56% due to increased investment in the Optimus robot and artificial intelligence, according to Electrek. This combination of a top-line beat and margin pressure created mixed signals for market participants, as headline growth was tempered by rising costs. Meanwhile, special committees formed by Tesla and SpaceX to consider a potential merger, as confirmed by Elon Musk in Benzinga, introduced further strategic uncertainty, and the National Highway Traffic Safety Administration's ongoing investigation into Cybercab safety and school-zone complaints, covered by TradingKey, underscored the regulatory risks facing Tesla's autonomous vehicle ambitions.
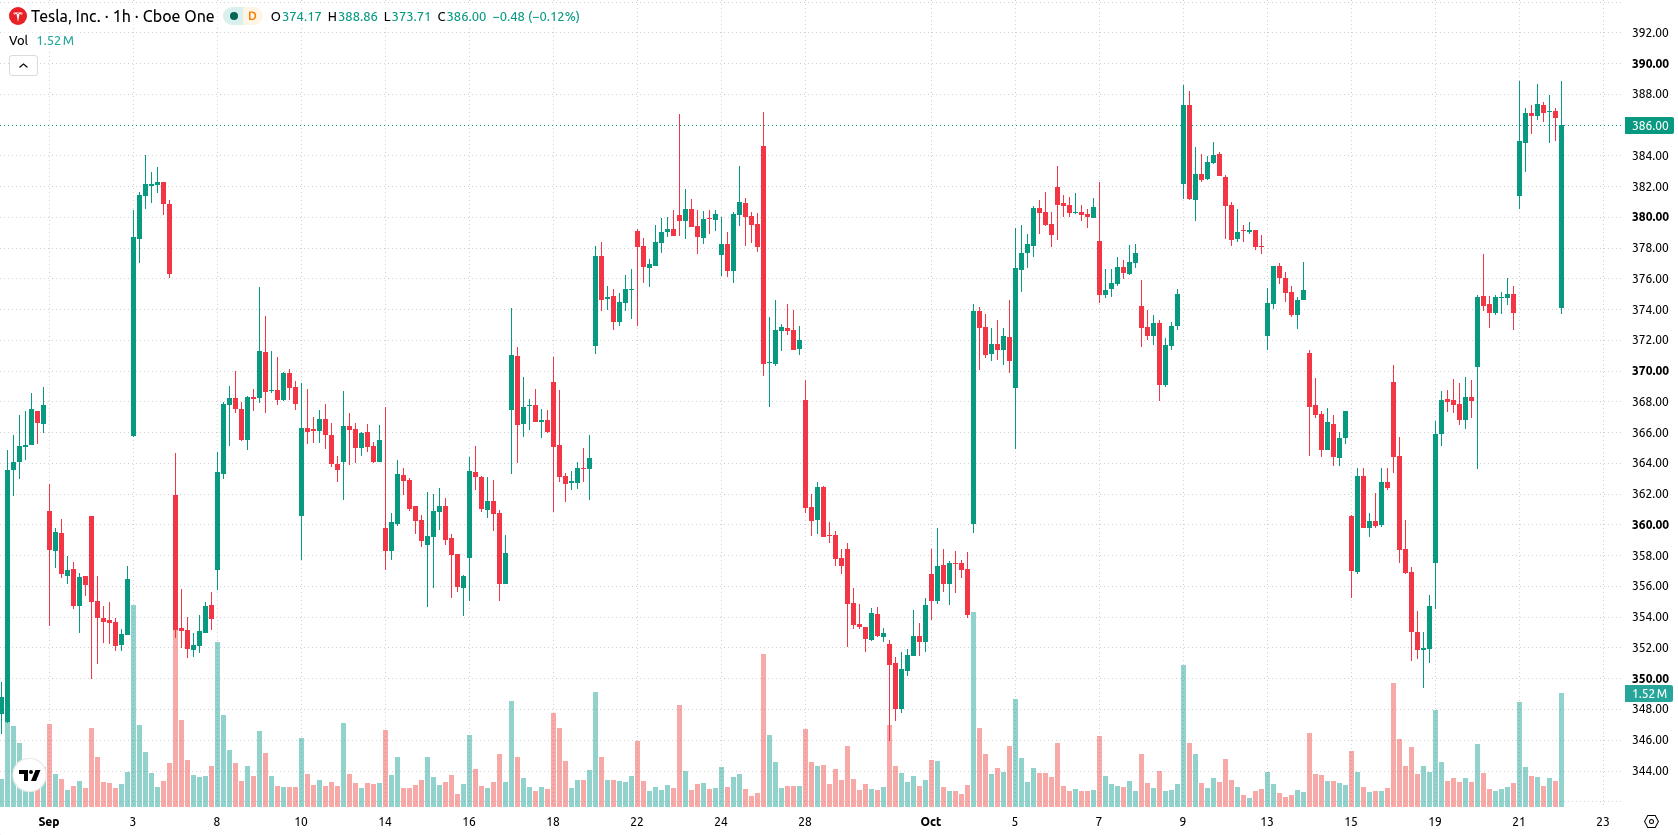
Support holds amid overbought signals and persistent bullish momentum
TSLA is trading above the MA-20 and MA-50 moving averages, but remains just below the long-term MA-200 resistance. The Ichimoku Kijun level at $372.11 is the nearest support anchoring current prices. Momentum indicators such as MACD and ADX show ongoing bullish pressure, while overbought signals from RSI, Stoch RSI, CCI, and Bull/Bear Power, as well as a neutral Awesome Oscillator, highlight a tension between persistent momentum and the risk of a short-term pullback.
Bullish bias prevails as price outlook hinges on support
Over the next two to three trading sessions, TSLA is expected to fluctuate within a typical volatility band between $368.66 and $403.9. The baseline scenario is that price will continue to move within this corridor. In a bullish case, TSLA could break above resistance to test the upper bound, while a drop below $372.11 would increase the risk of further declines. Probabilities currently suggest a strong bias towards upward movement and a low likelihood of a sustained dip.
Earlier, analysts noted that Tesla's stock faced headwinds from mixed tech earnings increased capital expenditures, and strategic uncertainty driven by potential corporate actions. In the current environment, traders should monitor the $372.11 support level closely, as a breach here could shift TSLA's technical outlook and raise the stakes for near-term downside risk.






Latest Tesla News





-
 Afghanistan
-
 Albania
-
 Algeria
-
 Angola
-
 Argentina
-
 Armenia
-
 Australia
-
 Austria
-
 Azerbaijan
-
 Bahamas
-
 Bahrain
-
 Bangladesh
-
 Belarus
-
 Belgium
-
 Bolivia
-
 Botswana
-
 Brazil
-
 Brunei
-
 Bulgaria
-
 Cambodia
-
 Cameroon
-
 Canada
-
 Chile
-
 China
-
 Colombia
-
 Congo
-
 Costa Rica
-
 Cote d'Ivoire
-
 Croatia
-
 Cuba
-
 Cyprus
-
 Czechia
-
 DR Congo
-
 Denmark
-
 Dominican Republic
-
 Ecuador
-
 Egypt
-
 El Salvador
-
 Estonia
-
 Eswatini
-
 Ethiopia
-
 Finland
-
 France
-
 Georgia
-
 Germany
-
 Ghana
-
 Greece
-
 Haiti
-
 Hong Kong
-
 Hungary
-
 India
-
 Indonesia
-
 Iran, Islamic republic
-
 Iraq
-
 Ireland
-
 Israel
-
 Italy
-
 Jamaica
-
 Japan
-
 Jordan
-
 Kazakhstan
-
 Kenya
-
 Korea
-
 Kuwait
-
 Kyrgyzstan
-
 Laos
-
 Latvia
-
 Lebanon
-
 Lesotho
-
 Libya
-
 Lithuania
-
 Luxembourg
-
 Madagascar
-
 Malaysia
-
 Malta
-
 Mauritius
-
 Mexico
-
 Moldova
-
 Mongolia
-
 Montenegro
-
 Morocco
-
 Mozambique
-
 Myanmar
-
 Namibia
-
 Nepal
-
 Netherlands
-
 New Zealand
-
 Nigeria
-
 North Macedonia
-
 Norway
-
 Oman
-
 Pakistan
-
 Palestine
-
 Panama
-
 Papua New Guinea
-
 Paraguay
-
 Peru
-
 Philippines
-
 Poland
-
 Portugal
-
 Puerto Rico
-
 Qatar
-
 Reunion
-
 Romania
-
 Rwanda
-
 Saudi Arabia
-
 Serbia
-
 Singapore
-
 Slovakia
-
 Slovenia
-
 Somalia
-
 South Africa
-
 Spain
-
 Sri Lanka
-
 Sweden
-
 Switzerland
-
 Syria
-
 Taiwan
-
 Tajikistan
-
 Tanzania
-
 Thailand
-
 Trinidad and Tobago
-
 Tunisia
-
 Turkey
-
 UAE
-
 Uganda
-
 Ukraine
-
 United Kingdom
-
United States
-
 Uruguay
-
 Uzbekistan
-
 Venezuela
-
 Vietnam
-
 Yemen
-
 Zambia
-
 Zimbabwe
- Forex
- Crypto












