

QUBT slides over 3% as negative momentum persists below key moving averages

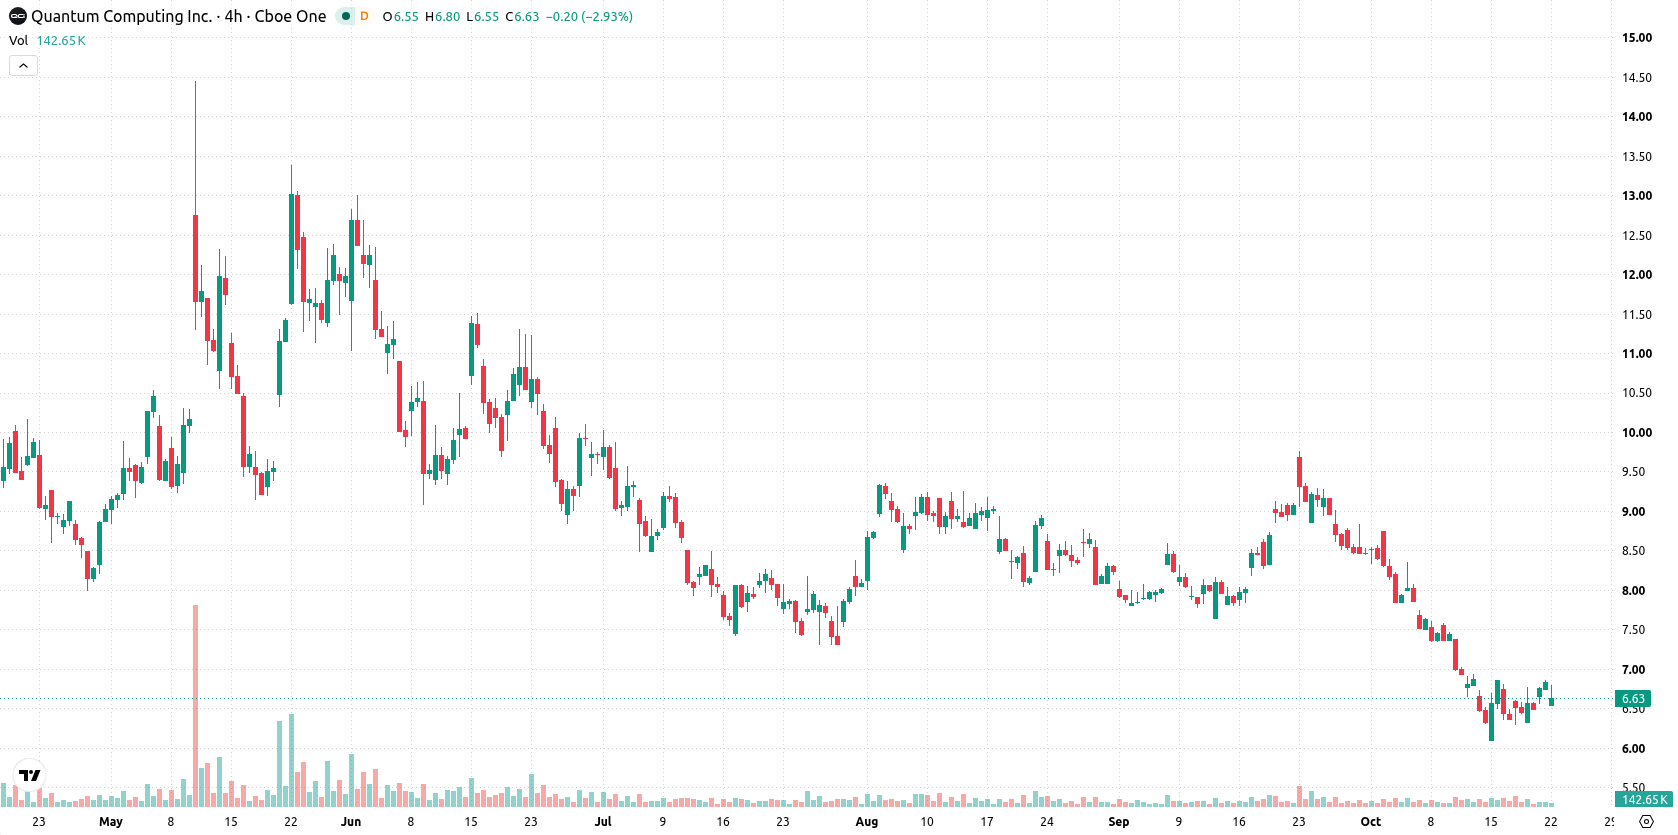
Quantum Computing Inc. (QUBT) dropped 3.17% after persistent technical weakness weighed on sentiment. The move is supported by the stock trading below its 20-day, 50-day, and 200-day moving averages, confirming control by sellers across key timeframes.
 6.66
6.85
Highlights
- Quantum Computing stock trades below major moving averages with sellers maintaining pressure across all key timeframes.
- Technical indicators including MACD, ADX, and CCI register negative momentum signals, with a current price of $6.62 near today’s low.
- For the next five days, the predicted range is $6.35 to $7.01 with a 76% probability of further declines.
Muted price action as absence of news steers sentiment
No new company-specific announcements were reported for Quantum Computing Inc. on the target date.
Technical barriers reinforce negative momentum as multiple indicators confirm sell bias
Quantum Computing is trading below the 20-day, 50-day, and 200-day moving averages at $7.58, $8.07, and $8.93 respectively, indicating persistent pressure from sellers across all major timeframes. The near-term ceiling is set at $6.85 and the near-term floor at $6.55, with key trend confirmations found much higher at the Ichimoku Kijun of $7.9 and major moving averages. Momentum gauges show negative signals: Moving Average Convergence Divergence (MACD) and Average Directional Index (ADX) both forecast a sell, reflecting trend momentum favoring sellers. The Relative Strength Index (RSI) is 38.73 with a “Sell” outlook, and the Commodity Channel Index (CCI) is also in the “Sell” zone. Stochastic RSI reads 78.44 with a neutral forecast, suggesting conditions are not oversold. Bull/Bear Power (BBP) at -0.17 confirms sellers dominate intraday momentum. The stock opened with a downside gap of approximately $0.19, or -2.78%, and has slipped $0.22 or 3.17% to $6.62, trading near today’s low. Intraday volatility stands at 4.58%. Price action remains under pressure after the open, and the negative momentum signals are broadly confirmed by daily losses.
Earlier, analysts noted that Quantum Computing Inc. continued to display persistent technical weakness and prevailing downside momentum. The current analysis confirms this bearish momentum, with traders advised to monitor the $6.55 support as a potential inflection point for further downside risk.











-
 Afghanistan
-
 Albania
-
 Algeria
-
 Angola
-
 Argentina
-
 Armenia
-
 Australia
-
 Austria
-
 Azerbaijan
-
 Bahamas
-
 Bahrain
-
 Bangladesh
-
 Belarus
-
 Belgium
-
 Bolivia
-
 Botswana
-
 Brazil
-
 Brunei
-
 Bulgaria
-
 Cambodia
-
 Cameroon
-
 Canada
-
 Chile
-
 China
-
 Colombia
-
 Congo
-
 Costa Rica
-
 Cote d'Ivoire
-
 Croatia
-
 Cuba
-
 Cyprus
-
 Czechia
-
 DR Congo
-
 Denmark
-
 Dominican Republic
-
 Ecuador
-
 Egypt
-
 El Salvador
-
 Estonia
-
 Eswatini
-
 Ethiopia
-
 Finland
-
 France
-
 Georgia
-
 Germany
-
 Ghana
-
 Greece
-
 Haiti
-
 Hong Kong
-
 Hungary
-
 India
-
 Indonesia
-
 Iran, Islamic republic
-
 Iraq
-
 Ireland
-
 Israel
-
 Italy
-
 Jamaica
-
 Japan
-
 Jordan
-
 Kazakhstan
-
 Kenya
-
 Korea
-
 Kuwait
-
 Kyrgyzstan
-
 Laos
-
 Latvia
-
 Lebanon
-
 Lesotho
-
 Libya
-
 Lithuania
-
 Luxembourg
-
 Madagascar
-
 Malaysia
-
 Malta
-
 Mauritius
-
 Mexico
-
 Moldova
-
 Mongolia
-
 Montenegro
-
 Morocco
-
 Mozambique
-
 Myanmar
-
 Namibia
-
 Nepal
-
 Netherlands
-
 New Zealand
-
 Nigeria
-
 North Macedonia
-
 Norway
-
 Oman
-
 Pakistan
-
 Palestine
-
 Panama
-
 Papua New Guinea
-
 Paraguay
-
 Peru
-
 Philippines
-
 Poland
-
 Portugal
-
 Puerto Rico
-
 Qatar
-
 Reunion
-
 Romania
-
 Rwanda
-
 Saudi Arabia
-
 Serbia
-
 Singapore
-
 Slovakia
-
 Slovenia
-
 Somalia
-
 South Africa
-
 Spain
-
 Sri Lanka
-
 Sweden
-
 Switzerland
-
 Syria
-
 Taiwan
-
 Tajikistan
-
 Tanzania
-
 Thailand
-
 Trinidad and Tobago
-
 Tunisia
-
 Turkey
-
 UAE
-
 Uganda
-
 Ukraine
-
 United Kingdom
-
United States
-
 Uruguay
-
 Uzbekistan
-
 Venezuela
-
 Vietnam
-
 Yemen
-
 Zambia
-
 Zimbabwe
- Forex
- Crypto












