

Amazon shares technical analysis: Downward price move with risk of deeper losses below $245.68 support

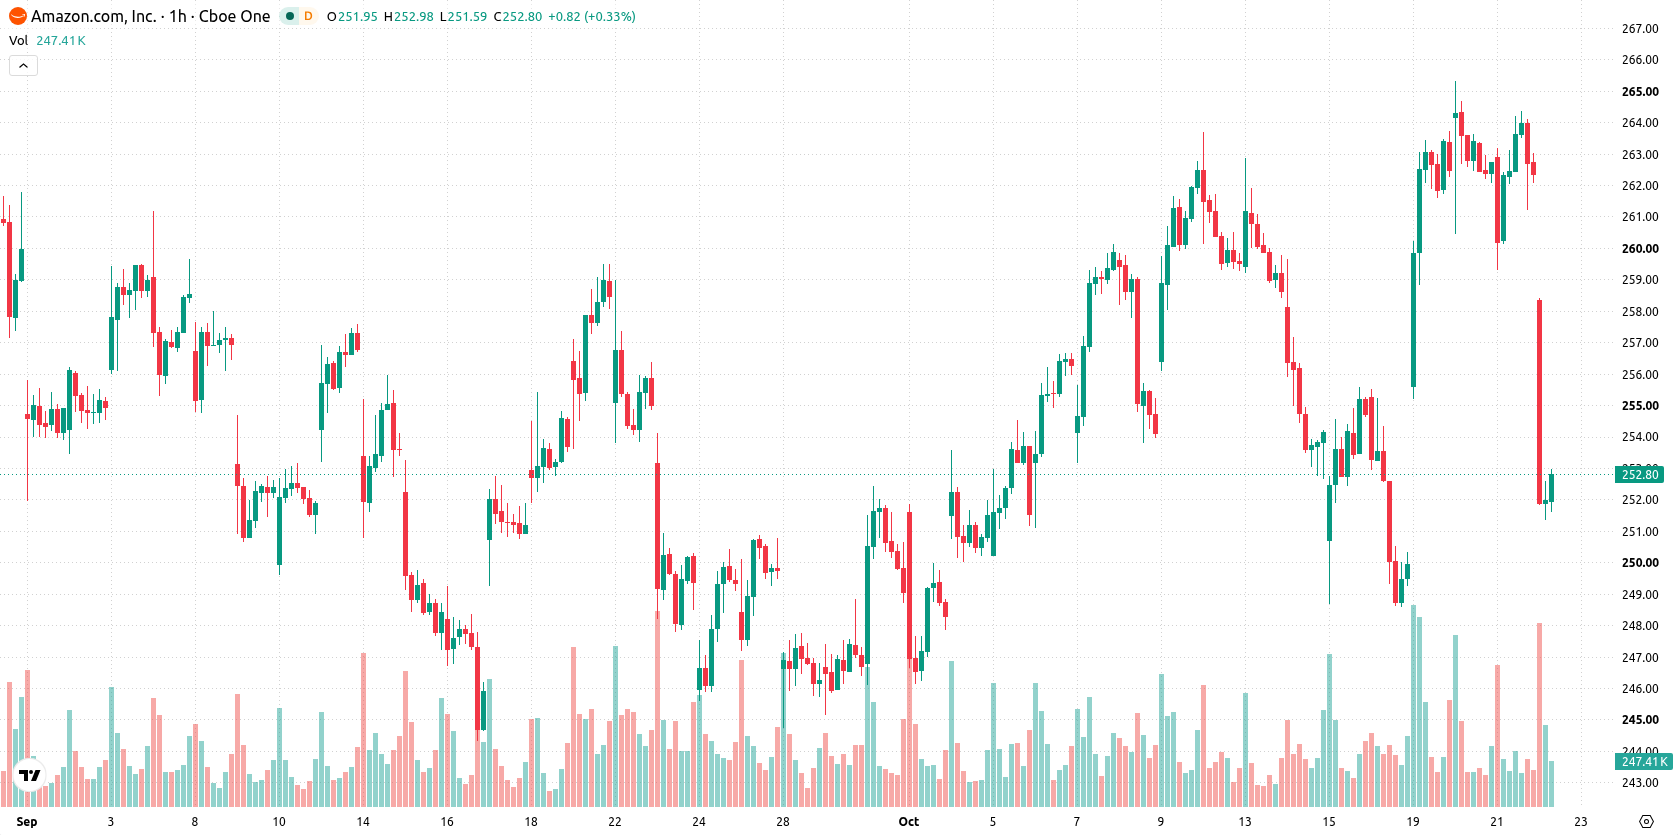
Amazon (AMZN) stock is trading at $252.81, down 3.64% for the day. The price sits below its key short- and medium-term moving averages, while remaining above longer-term trend support.
 241.55
255.18
Highlights
- Amazon plans to report third quarter 2026 earnings on October 29 after the market closes, drawing increased market attention.
- The company raised its 2026 capital expenditure target to about $220 billion, increasing scrutiny of its cash flow and investment discipline.
- Shares of Amazon closed at $252.81 after dropping 3.64% and trade below short- and medium-term moving averages, with a projected 2 to 3 day range of $245.68 to $259.94 and a higher probability of downside movement.
Investor caution rises as earnings loom and capex targets increase
Amazon is set to report its third quarter 2026 earnings on October 29 after market close, an imminent event that is contributing to increased market attention and positioning ahead of the announcement. The company has also raised its capital expenditure guidance to approximately $220 billion for 2026, a figure that, according to Primexbt, has led to heightened scrutiny of cash flow management and long-term profitability. These factors are focusing investor sentiment on Amazon's spending discipline and the sustainability of its investments as the earnings release approaches.
Momentum divergence grows as technical resistance caps price action
On the hourly chart, AMZN remains below both its MA-20 at $262.82 and MA-50 at $258.03, while the daily MA-200 at $243.2 provides long-term support. The Ichimoku Kijun is now at $256.97, marking immediate resistance. The current expected trading range is $245.68 to $259.94. Among momentum signals, the MACD shows a strong buy signal, while the ADX, CCI, and Awesome Oscillator are neutral. RSI and Stoch RSI both indicate buy conditions, while Bull/Bear Power signals an overbought environment, highlighting a divergence between momentum indicators and actual price action.
Sideways bias holds as downside risk outweighs upside reversal odds
Over the next two to three trading days, AMZN is likely to remain within a $245.68 to $259.94 volatility band. The baseline expectation is for the price to move sideways, with a 76% probability of further downside and a 24% chance of an upside reversal. A bullish scenario would require a break above the $256.97 resistance, which could trigger additional buying. Conversely, a sustained move below $245.68 would open the way for deeper losses.
Previously it was reported that Amazon shares were consolidating within a narrow range as traders awaited clarity from upcoming earnings and key technical levels. The current setup adds a new dimension by highlighting heightened focus on Amazon's capital expenditure and cash flow discipline ahead of its earnings report, with the $256.97 resistance remaining the crucial level for a potential upside move.











-
 Afghanistan
-
 Albania
-
 Algeria
-
 Angola
-
 Argentina
-
 Armenia
-
 Australia
-
 Austria
-
 Azerbaijan
-
 Bahamas
-
 Bahrain
-
 Bangladesh
-
 Belarus
-
 Belgium
-
 Bolivia
-
 Botswana
-
 Brazil
-
 Brunei
-
 Bulgaria
-
 Cambodia
-
 Cameroon
-
 Canada
-
 Chile
-
 China
-
 Colombia
-
 Congo
-
 Costa Rica
-
 Cote d'Ivoire
-
 Croatia
-
 Cuba
-
 Cyprus
-
 Czechia
-
 DR Congo
-
 Denmark
-
 Dominican Republic
-
 Ecuador
-
 Egypt
-
 El Salvador
-
 Estonia
-
 Eswatini
-
 Ethiopia
-
 Finland
-
 France
-
 Georgia
-
 Germany
-
 Ghana
-
 Greece
-
 Haiti
-
 Hong Kong
-
 Hungary
-
 India
-
 Indonesia
-
 Iran, Islamic republic
-
 Iraq
-
 Ireland
-
 Israel
-
 Italy
-
 Jamaica
-
 Japan
-
 Jordan
-
 Kazakhstan
-
 Kenya
-
 Korea
-
 Kuwait
-
 Kyrgyzstan
-
 Laos
-
 Latvia
-
 Lebanon
-
 Lesotho
-
 Libya
-
 Lithuania
-
 Luxembourg
-
 Madagascar
-
 Malaysia
-
 Malta
-
 Mauritius
-
 Mexico
-
 Moldova
-
 Mongolia
-
 Montenegro
-
 Morocco
-
 Mozambique
-
 Myanmar
-
 Namibia
-
 Nepal
-
 Netherlands
-
 New Zealand
-
 Nigeria
-
 North Macedonia
-
 Norway
-
 Oman
-
 Pakistan
-
 Palestine
-
 Panama
-
 Papua New Guinea
-
 Paraguay
-
 Peru
-
 Philippines
-
 Poland
-
 Portugal
-
 Puerto Rico
-
 Qatar
-
 Reunion
-
 Romania
-
 Rwanda
-
 Saudi Arabia
-
 Serbia
-
 Singapore
-
 Slovakia
-
 Slovenia
-
 Somalia
-
 South Africa
-
 Spain
-
 Sri Lanka
-
 Sweden
-
 Switzerland
-
 Syria
-
 Taiwan
-
 Tajikistan
-
 Tanzania
-
 Thailand
-
 Trinidad and Tobago
-
 Tunisia
-
 Turkey
-
 UAE
-
 Uganda
-
 Ukraine
-
 United Kingdom
-
United States
-
 Uruguay
-
 Uzbekistan
-
 Venezuela
-
 Vietnam
-
 Yemen
-
 Zambia
-
 Zimbabwe
- Forex
- Crypto












