

CME rallies as strong earnings and shareholder returns attract buyers

CME Group (CME) stock is trading at $306.09, up 3.48% on the day and holding above its key moving averages. The price remains near today’s session high amid moderate volatility.
 306.70
309.19
Highlights
- CME Group posted record third-quarter 2026 revenue of $1.74 billion, exceeding analyst expectations for the period.
- Net income reached $1.04 billion with diluted earnings per share of $2.89, and the company returned nearly $1 billion to shareholders through dividends and buybacks.
- Shares of CME trade in a bullish trend with strong buyer momentum indicators; the short-term expected price range is $301.03 to $310.67.
Record revenue and capital returns bolster bullish investor sentiment
CME Group reported record third-quarter 2026 revenue of $1.74 billion, surpassing analyst expectations and signaling robust demand for its core trading services. Profitability remains strong with net income reaching $1.04 billion and diluted earnings per share of $2.89, confirming the company's financial strength. Additionally, CME Group returned nearly $1 billion to shareholders through a combination of $465 million in dividends and $524 million in share repurchases, according to Quiverquant, providing further incentive for investor participation.
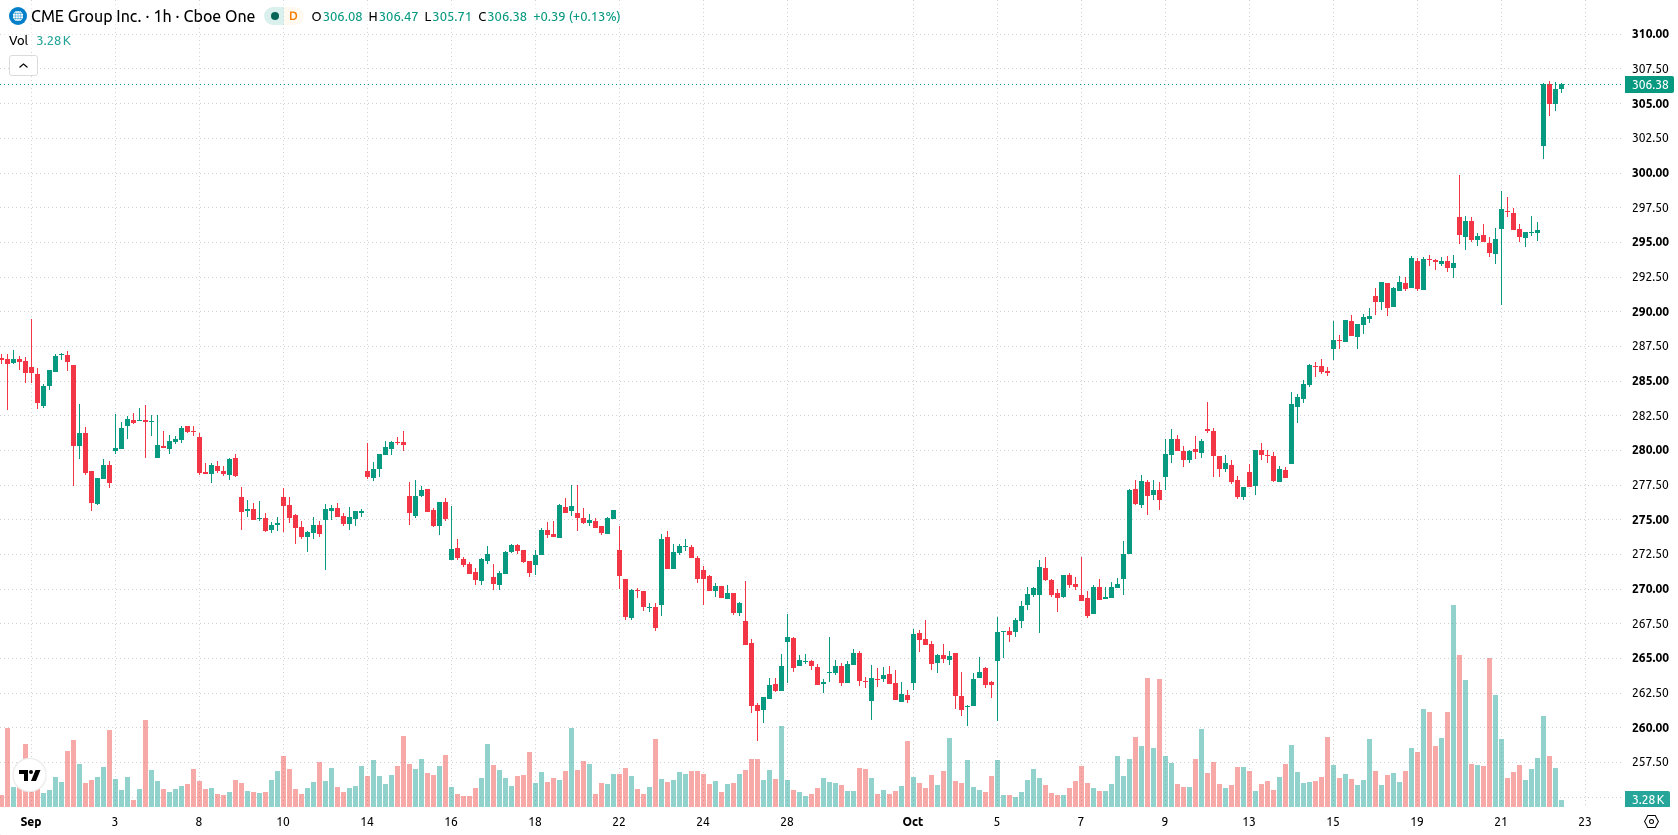
Overbought signals as buying momentum aligns with technical support
On the hourly chart, CME is trading above the MA-20 ($295.62) and MA-50 ($290.17), while the daily chart shows it holding above the MA-200 ($279.02). Immediate support is located at the Ichimoku Kijun level of $298. Momentum is confirmed by both MACD and ADX, which indicate continued buying strength. Meanwhile, RSI, CCI, Stochastic RSI, and Bull/Bear Power all signal overbought conditions, highlighting heightened intraday demand. The Awesome Oscillator remains neutral, suggesting some divergence among oscillators.
Upside bias prevails amid range-bound short-term outlook
In the short term, CME is expected to consolidate within a typical volatility band between $301.03 and $310.67. The probability of an upside attempt to challenge or exceed range highs is very high, while downside risk becomes more likely if the price falls below $301.03. The baseline scenario is for price action to remain confined to this range over the next several sessions.
Previously it was reported that CME Group delivered record quarterly results and maintained a broadly bullish price structure. The latest earnings beat and robust capital returns reinforce the company's strong positioning, with price action warranting particular attention to any sustained moves beyond the current $301.03–$310.67 consolidation range.






Latest CME Group News




-
 Afghanistan
-
 Albania
-
 Algeria
-
 Angola
-
 Argentina
-
 Armenia
-
 Australia
-
 Austria
-
 Azerbaijan
-
 Bahamas
-
 Bahrain
-
 Bangladesh
-
 Belarus
-
 Belgium
-
 Bolivia
-
 Botswana
-
 Brazil
-
 Brunei
-
 Bulgaria
-
 Cambodia
-
 Cameroon
-
 Canada
-
 Chile
-
 China
-
 Colombia
-
 Congo
-
 Costa Rica
-
 Cote d'Ivoire
-
 Croatia
-
 Cuba
-
 Cyprus
-
 Czechia
-
 DR Congo
-
 Denmark
-
 Dominican Republic
-
 Ecuador
-
 Egypt
-
 El Salvador
-
 Estonia
-
 Eswatini
-
 Ethiopia
-
 Finland
-
 France
-
 Georgia
-
 Germany
-
 Ghana
-
 Greece
-
 Haiti
-
 Hong Kong
-
 Hungary
-
 India
-
 Indonesia
-
 Iran, Islamic republic
-
 Iraq
-
 Ireland
-
 Israel
-
 Italy
-
 Jamaica
-
 Japan
-
 Jordan
-
 Kazakhstan
-
 Kenya
-
 Korea
-
 Kuwait
-
 Kyrgyzstan
-
 Laos
-
 Latvia
-
 Lebanon
-
 Lesotho
-
 Libya
-
 Lithuania
-
 Luxembourg
-
 Madagascar
-
 Malaysia
-
 Malta
-
 Mauritius
-
 Mexico
-
 Moldova
-
 Mongolia
-
 Montenegro
-
 Morocco
-
 Mozambique
-
 Myanmar
-
 Namibia
-
 Nepal
-
 Netherlands
-
 New Zealand
-
 Nigeria
-
 North Macedonia
-
 Norway
-
 Oman
-
 Pakistan
-
 Palestine
-
 Panama
-
 Papua New Guinea
-
 Paraguay
-
 Peru
-
 Philippines
-
 Poland
-
 Portugal
-
 Puerto Rico
-
 Qatar
-
 Reunion
-
 Romania
-
 Rwanda
-
 Saudi Arabia
-
 Serbia
-
 Singapore
-
 Slovakia
-
 Slovenia
-
 Somalia
-
 South Africa
-
 Spain
-
 Sri Lanka
-
 Sweden
-
 Switzerland
-
 Syria
-
 Taiwan
-
 Tajikistan
-
 Tanzania
-
 Thailand
-
 Trinidad and Tobago
-
 Tunisia
-
 Turkey
-
 UAE
-
 Uganda
-
 Ukraine
-
 United Kingdom
-
United States
-
 Uruguay
-
 Uzbekistan
-
 Venezuela
-
 Vietnam
-
 Yemen
-
 Zambia
-
 Zimbabwe
- Forex
- Crypto












