

CME slips as short-term trend stays under seller pressure

CME Group Inc. (CME) stock is trading at $298.46, down 3.12% for the day. The price sits below its key short- and medium-term moving averages, indicating near-term pressure, but remains above major longer-term support levels.
 306.45
309.19
Highlights
- CME Group reported third quarter revenue of $1.74 billion with record average daily volume and open interest.
- The company returned about $1 billion to shareholders and expanded its futures products to diversify its business.
- Shares of CME closed down 3.12%, trading below key moving averages with sellers in control and an expected range of $290.03 to $306.89.
Strong quarterly results drive capital returns amid selling pressure
CME Group Inc. recorded stronger-than-expected third quarter results, including $1.74 billion in revenue, record average daily volume, and record open interest, according to TradingView. These results confirmed robust demand for the company's futures products and supported strong operating cash flow. CME also returned approximately $1 billion to shareholders and expanded its futures offerings, underscoring ongoing efforts to diversify its business and return capital, though price action has remained under broader selling pressure.
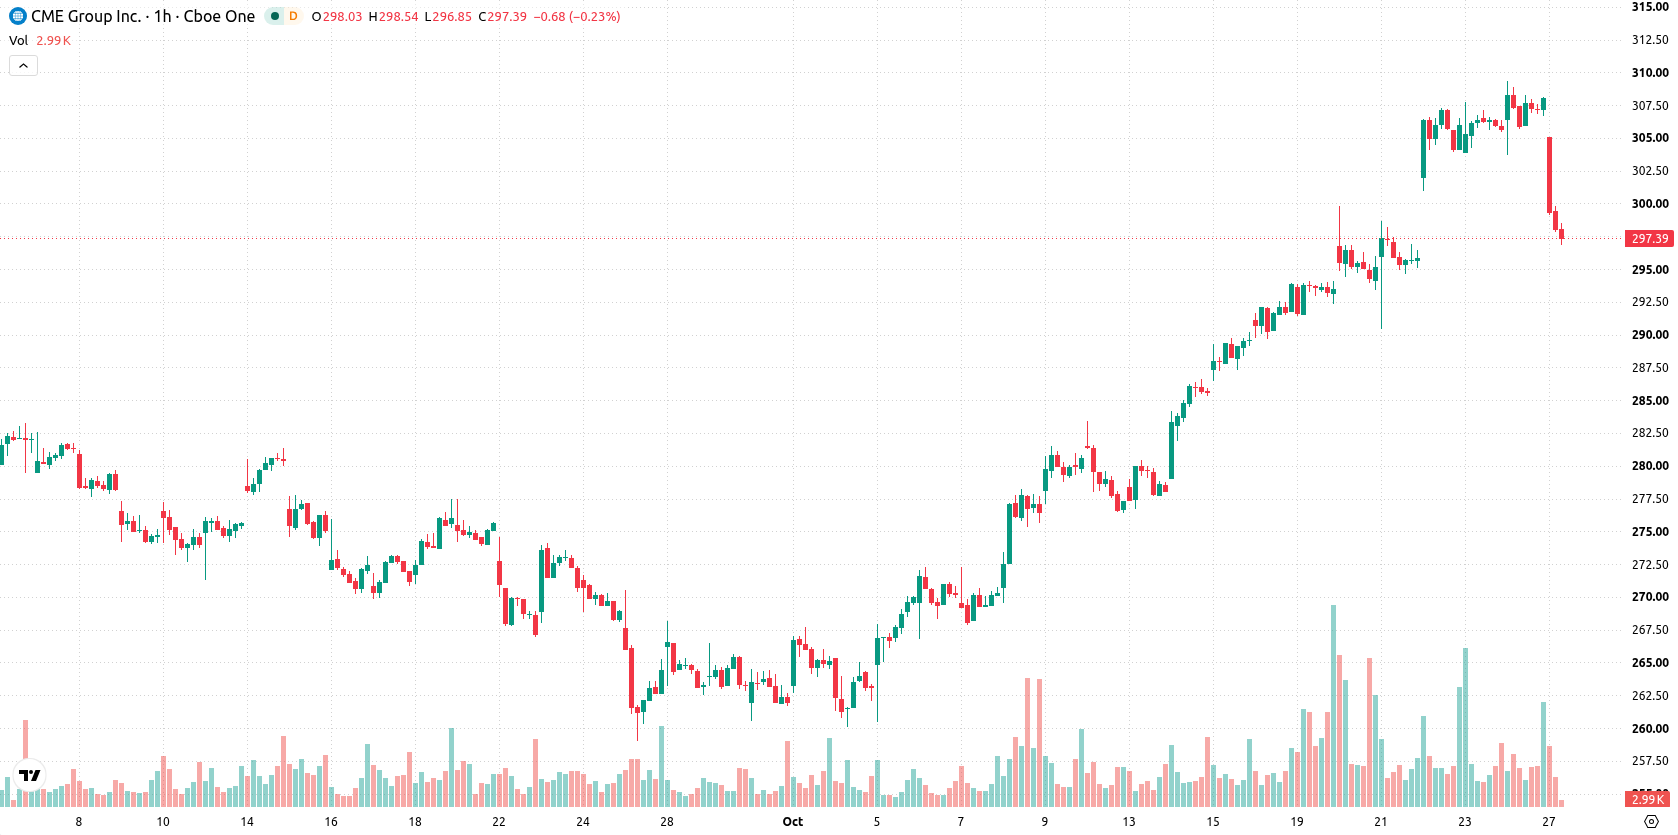
Mixed momentum and resistance at Kijun shape technical outlook
On the hourly timeframe, CME is trading beneath both the MA-20 at $306.2 and the MA-50 at $299.43, while remaining above the MA-200 at $279.6, which provides long-term support. The Ichimoku Kijun sits at $302 and currently serves as immediate resistance. Momentum indicators are mixed: MACD issues a strong buy signal, but ADX suggests a sell; RSI at 43.52, along with Stochastic RSI and CCI, indicates oversold conditions. Bull/Bear Power data points to seller dominance intraday, while the Awesome Oscillator stays neutral.
Sideways trading likely as downside risk edges higher
Over the coming two to three trading days, CME is expected to move within a typical volatility band between $290.03 and $306.89. There is a modestly higher likelihood of a downward move (52% probability) compared to an upward reversal (48%). The base case anticipates CME stabilizing within a sideways corridor; a bullish scenario would involve a break above the $302 resistance, while a bearish turn would see prices slip below the $290 support.
Previously it was reported that CME Group's strong financial performance and sustained capital returns underpinned a broadly bullish outlook for the stock. The current analysis introduces a shift, as technical signals highlight continued near-term selling pressure, making movement above the $302 resistance a key development to monitor.






Latest CME Group News




-
 Afghanistan
-
 Albania
-
 Algeria
-
 Angola
-
 Argentina
-
 Armenia
-
 Australia
-
 Austria
-
 Azerbaijan
-
 Bahamas
-
 Bahrain
-
 Bangladesh
-
 Belarus
-
 Belgium
-
 Bolivia
-
 Botswana
-
 Brazil
-
 Brunei
-
 Bulgaria
-
 Cambodia
-
 Cameroon
-
 Canada
-
 Chile
-
 China
-
 Colombia
-
 Congo
-
 Costa Rica
-
 Cote d'Ivoire
-
 Croatia
-
 Cuba
-
 Cyprus
-
 Czechia
-
 DR Congo
-
 Denmark
-
 Dominican Republic
-
 Ecuador
-
 Egypt
-
 El Salvador
-
 Estonia
-
 Eswatini
-
 Ethiopia
-
 Finland
-
 France
-
 Georgia
-
 Germany
-
 Ghana
-
 Greece
-
 Haiti
-
 Hong Kong
-
 Hungary
-
 India
-
 Indonesia
-
 Iran, Islamic republic
-
 Iraq
-
 Ireland
-
 Israel
-
 Italy
-
 Jamaica
-
 Japan
-
 Jordan
-
 Kazakhstan
-
 Kenya
-
 Korea
-
 Kuwait
-
 Kyrgyzstan
-
 Laos
-
 Latvia
-
 Lebanon
-
 Lesotho
-
 Libya
-
 Lithuania
-
 Luxembourg
-
 Madagascar
-
 Malaysia
-
 Malta
-
 Mauritius
-
 Mexico
-
 Moldova
-
 Mongolia
-
 Montenegro
-
 Morocco
-
 Mozambique
-
 Myanmar
-
 Namibia
-
 Nepal
-
 Netherlands
-
 New Zealand
-
 Nigeria
-
 North Macedonia
-
 Norway
-
 Oman
-
 Pakistan
-
 Palestine
-
 Panama
-
 Papua New Guinea
-
 Paraguay
-
 Peru
-
 Philippines
-
 Poland
-
 Portugal
-
 Puerto Rico
-
 Qatar
-
 Reunion
-
 Romania
-
 Rwanda
-
 Saudi Arabia
-
 Serbia
-
 Singapore
-
 Slovakia
-
 Slovenia
-
 Somalia
-
 South Africa
-
 Spain
-
 Sri Lanka
-
 Sweden
-
 Switzerland
-
 Syria
-
 Taiwan
-
 Tajikistan
-
 Tanzania
-
 Thailand
-
 Trinidad and Tobago
-
 Tunisia
-
 Turkey
-
 UAE
-
 Uganda
-
 Ukraine
-
 United Kingdom
-
United States
-
 Uruguay
-
 Uzbekistan
-
 Venezuela
-
 Vietnam
-
 Yemen
-
 Zambia
-
 Zimbabwe
- Forex
- Crypto












