

Will Qualcomm stock hold above $169.82 support amid weak momentum and intraday selling pressure?

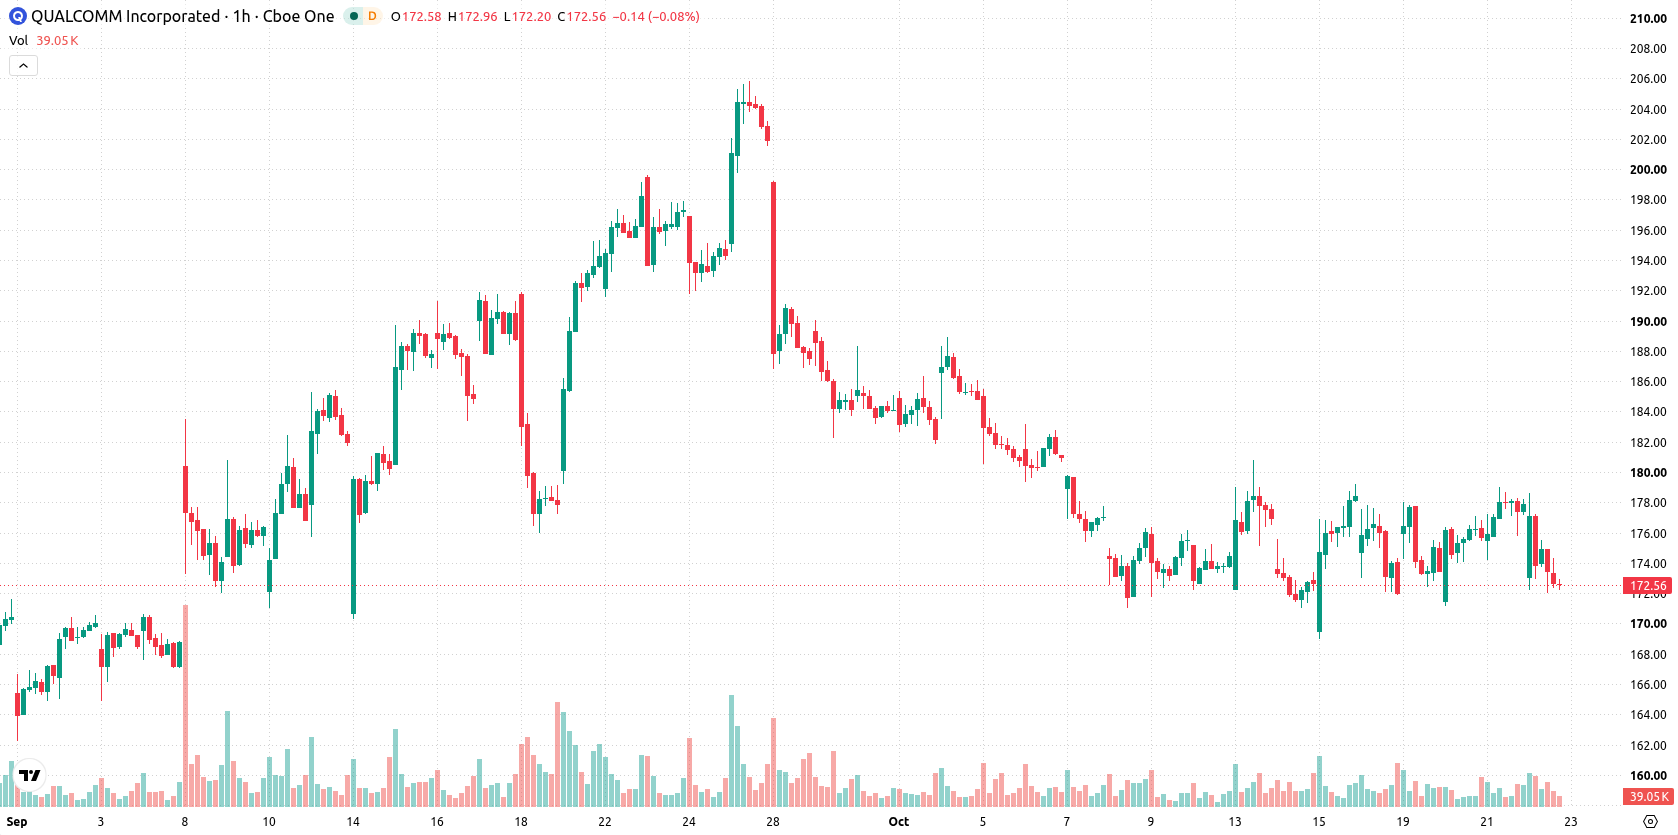
Qualcomm Inc. (QCOM) stock is trading at $172.97, down 2.8% for the day. The price sits below its key moving averages, reflecting persistent intraday weakness following recent selling pressure.
 185.54
Highlights
- Qualcomm will pay a quarterly cash dividend of $0.92 per share on December 17, 2026, to holders of record as of December 3, 2026.
- The company is initiating global layoffs in November 2026 during a workforce review, and its CFO and COO sold 2,500 shares on October 20, 2026.
- Shares of Qualcomm fell 2.8% to $172.97, trading below key short- and medium-term moving averages, with the stock expected to consolidate between $169.82 and $176.12 in the near term.
Management cost controls and insider sales stir employee uncertainty
Qualcomm announced a quarterly cash dividend of $0.92 per common share, with payment scheduled for December 17, 2026, to shareholders of record as of December 3, 2026, according to Yahoo Finance. The company is set to initiate global layoffs in November 2026 as part of an ongoing workforce review, a move that signals efforts to manage costs but may create uncertainty for employees, as reported by Analyticsinsight. Additionally, insider activity was recorded when CFO and COO Akash Palkhiwala sold 2,500 shares of company stock on October 20, 2026, according to Gurufocus, an occurrence that can be interpreted as cautious executive behavior in the current environment.
Mixed momentum and oversold signals as resistance holds
On the technical front, QCOM is trading below both the MA-20 ($175.72) and MA-50 ($175.55) on the H1 chart, while remaining above the MA-200 ($169.39) on the daily timeframe. The Ichimoku Kijun sits at $175.06, acting as immediate resistance. Momentum indicators paint a mixed picture: MACD is signaling a strong buy, whereas ADX trends neutral. RSI is at 39.82, indicating a selling bias, and both Stochastic RSI and CCI confirm oversold conditions. Bull/Bear Power readings show strong dominance by sellers in the intraday session, aligning with the current downward pressure. Divergence among these indicators suggests uncertainty about direction, with oscillators pointing to oversold, while trend measures do not confirm a reversal.
Consolidation range likely amid prevalent downside risks
Over the next several trading days, QCOM is expected to oscillate within a volatility band of $169.82 to $176.12. The probability of an upward move is limited to 32%, while a downward scenario remains more likely given the prevailing momentum and trend configuration. Baseline expectations call for a period of consolidation within this range. Should price break above the $175.06 resistance, a move toward the upper boundary becomes possible, while a drop below $169.82 could expose further downside risks.
Previously it was reported that Qualcomm planned global workforce reductions as part of a strategic shift amid challenging market conditions. The current technical outlook reinforces a cautious stance, with downside risk prevailing if the price falls below $169.82 over the coming sessions.






Latest Qualcomm News





-
 Afghanistan
-
 Albania
-
 Algeria
-
 Angola
-
 Argentina
-
 Armenia
-
 Australia
-
 Austria
-
 Azerbaijan
-
 Bahamas
-
 Bahrain
-
 Bangladesh
-
 Belarus
-
 Belgium
-
 Bolivia
-
 Botswana
-
 Brazil
-
 Brunei
-
 Bulgaria
-
 Cambodia
-
 Cameroon
-
 Canada
-
 Chile
-
 China
-
 Colombia
-
 Congo
-
 Costa Rica
-
 Cote d'Ivoire
-
 Croatia
-
 Cuba
-
 Cyprus
-
 Czechia
-
 DR Congo
-
 Denmark
-
 Dominican Republic
-
 Ecuador
-
 Egypt
-
 El Salvador
-
 Estonia
-
 Eswatini
-
 Ethiopia
-
 Finland
-
 France
-
 Georgia
-
 Germany
-
 Ghana
-
 Greece
-
 Haiti
-
 Hong Kong
-
 Hungary
-
 India
-
 Indonesia
-
 Iran, Islamic republic
-
 Iraq
-
 Ireland
-
 Israel
-
 Italy
-
 Jamaica
-
 Japan
-
 Jordan
-
 Kazakhstan
-
 Kenya
-
 Korea
-
 Kuwait
-
 Kyrgyzstan
-
 Laos
-
 Latvia
-
 Lebanon
-
 Lesotho
-
 Libya
-
 Lithuania
-
 Luxembourg
-
 Madagascar
-
 Malaysia
-
 Malta
-
 Mauritius
-
 Mexico
-
 Moldova
-
 Mongolia
-
 Montenegro
-
 Morocco
-
 Mozambique
-
 Myanmar
-
 Namibia
-
 Nepal
-
 Netherlands
-
 New Zealand
-
 Nigeria
-
 North Macedonia
-
 Norway
-
 Oman
-
 Pakistan
-
 Palestine
-
 Panama
-
 Papua New Guinea
-
 Paraguay
-
 Peru
-
 Philippines
-
 Poland
-
 Portugal
-
 Puerto Rico
-
 Qatar
-
 Reunion
-
 Romania
-
 Rwanda
-
 Saudi Arabia
-
 Serbia
-
 Singapore
-
 Slovakia
-
 Slovenia
-
 Somalia
-
 South Africa
-
 Spain
-
 Sri Lanka
-
 Sweden
-
 Switzerland
-
 Syria
-
 Taiwan
-
 Tajikistan
-
 Tanzania
-
 Thailand
-
 Trinidad and Tobago
-
 Tunisia
-
 Turkey
-
 UAE
-
 Uganda
-
 Ukraine
-
 United Kingdom
-
United States
-
 Uruguay
-
 Uzbekistan
-
 Venezuela
-
 Vietnam
-
 Yemen
-
 Zambia
-
 Zimbabwe
- Forex
- Crypto












