

HSBC stock declines amid strong seller dominance and negative technical signals

HSBC Holdings plc (HSBA) stock is trading at GBX1,364.60 after falling 2.43% today, closing near the session’s low. The share price remains below its key moving averages, signaling ongoing downward pressure in the short, medium, and long term.
 1292.40
1373.00
Highlights
- HSBC has made its Hong Kong dollar-backed RedCoin stablecoin available to 3.3 million PayMe users in Hong Kong.
- The initiative expands HSBC's digital payments reach and targets greater engagement within the region's digital finance ecosystem.
- Shares of HSBC trade below key moving averages, with strong selling pressure and a projected range of GBX1,331 to GBX1,397.
Stablecoin launch and digital push offset by muted price reaction
HSBC has launched its Hong Kong dollar-backed RedCoin stablecoin, extending access to 3.3 million users through its PayMe payments application in Hong Kong, according to FinanceFeeds. This rollout expands HSBC's footprint in the digital payments space, aiming to boost user engagement and transactional liquidity within Hong Kong’s digital finance ecosystem. While the move underscores the bank’s effort to innovate and diversify its product set, price action has remained under broader selling pressure.
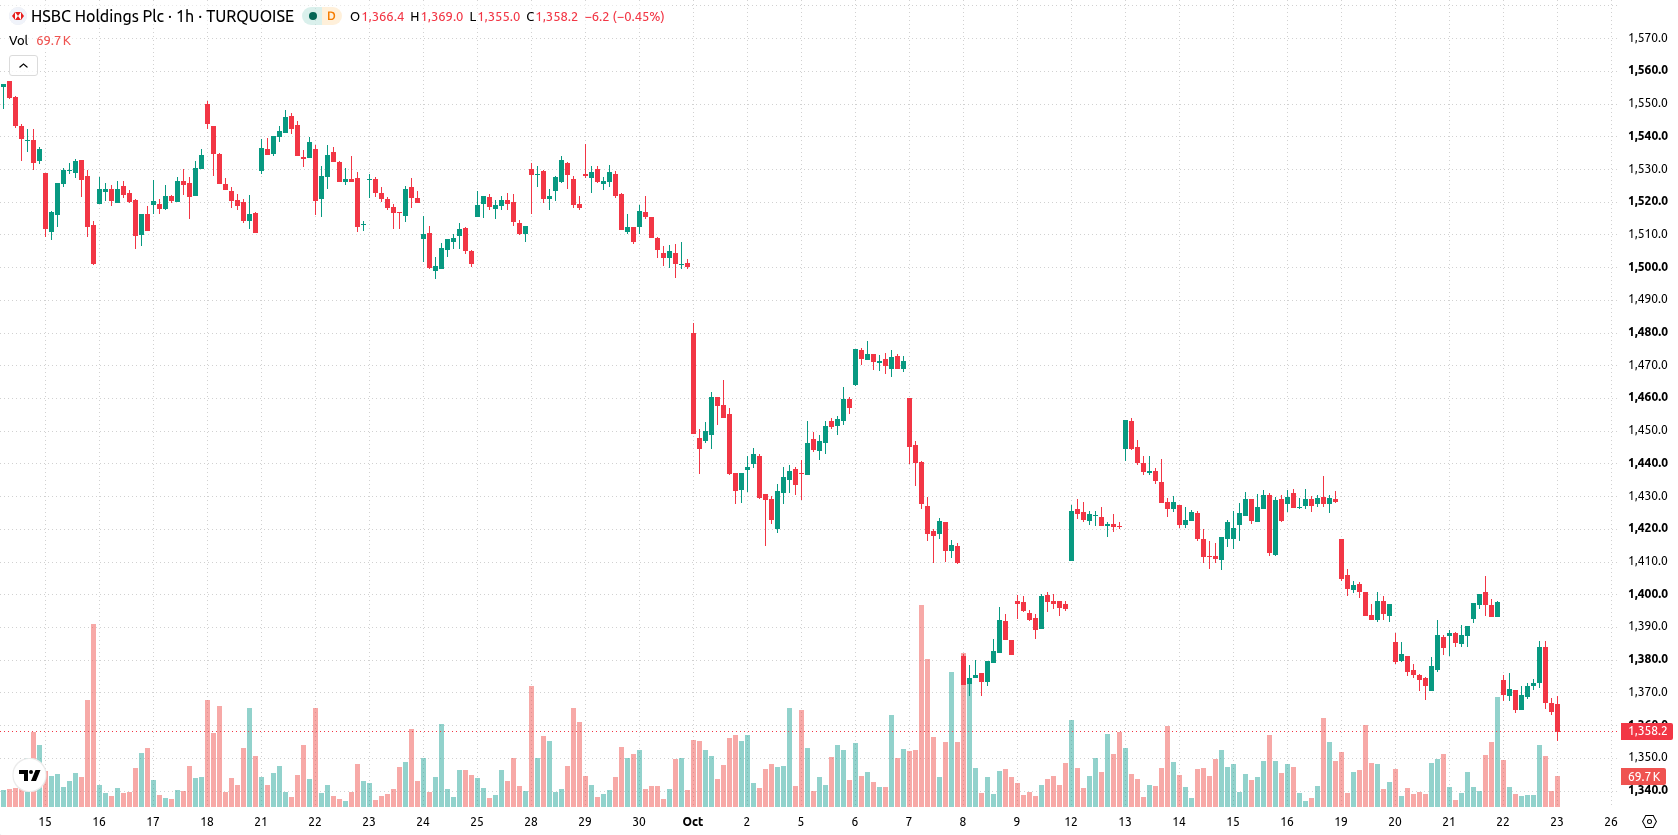
Intraday sell signals intensify as technical barriers limit upside
On the H1 chart, HSBA is trading below the MA-20 at GBX1,382 and the MA-50 at GBX1,396, as well as below the MA-200 at GBX1,384 on the daily timeframe. Immediate resistance is defined by the Ichimoku Kijun at GBX1,384. Momentum readings are predominantly negative, with MACD issuing a Sell signal and ADX neutral. The RSI sits at 38.26, also suggestive of a Sell bias, while CCI and Bull/Bear Power both indicate strongly oversold levels and seller dominance in intraday trading. Stochastic RSI and the Awesome Oscillator are neutral, reflecting mixed short-term momentum despite the market's oversold condition. The price closed with a negative gap of 23.6, ending close to the session low, which reinforces persistent downside momentum.
Rangebound outlook persists with downside risk beyond lower band
For the next several days, HSBA is expected to trade within a volatility band of GBX1,331 to GBX1,397. The base case scenario sees the price consolidating within this range as technical pressures persist. A bullish scenario would require an upside break above GBX1,384, coinciding with the Ichimoku Kijun and immediate resistance, which could then attract renewed buying interest. Conversely, a sustained drop below GBX1,331 would likely open the way for further declines.
Previously it was reported that HSBC launched its Hong Kong dollar-pegged RedCoin stablecoin to expand digital payment capabilities via the PayMe platform. While this development diversifies HSBC’s offerings, traders should closely monitor whether a break above GBX1,384 materializes, as it would be the first sign of potential upside momentum beyond the prevailing consolidation range.






Latest HSBC News




-
 Afghanistan
-
 Albania
-
 Algeria
-
 Angola
-
 Argentina
-
 Armenia
-
 Australia
-
 Austria
-
 Azerbaijan
-
 Bahamas
-
 Bahrain
-
 Bangladesh
-
 Belarus
-
 Belgium
-
 Bolivia
-
 Botswana
-
 Brazil
-
 Brunei
-
 Bulgaria
-
 Cambodia
-
 Cameroon
-
 Canada
-
 Chile
-
 China
-
 Colombia
-
 Congo
-
 Costa Rica
-
 Cote d'Ivoire
-
 Croatia
-
 Cuba
-
 Cyprus
-
 Czechia
-
 DR Congo
-
 Denmark
-
 Dominican Republic
-
 Ecuador
-
 Egypt
-
 El Salvador
-
 Estonia
-
 Eswatini
-
 Ethiopia
-
 Finland
-
 France
-
 Georgia
-
 Germany
-
 Ghana
-
 Greece
-
 Haiti
-
 Hong Kong
-
 Hungary
-
 India
-
 Indonesia
-
 Iran, Islamic republic
-
 Iraq
-
 Ireland
-
 Israel
-
 Italy
-
 Jamaica
-
 Japan
-
 Jordan
-
 Kazakhstan
-
 Kenya
-
 Korea
-
 Kuwait
-
 Kyrgyzstan
-
 Laos
-
 Latvia
-
 Lebanon
-
 Lesotho
-
 Libya
-
 Lithuania
-
 Luxembourg
-
 Madagascar
-
 Malaysia
-
 Malta
-
 Mauritius
-
 Mexico
-
 Moldova
-
 Mongolia
-
 Montenegro
-
 Morocco
-
 Mozambique
-
 Myanmar
-
 Namibia
-
 Nepal
-
 Netherlands
-
 New Zealand
-
 Nigeria
-
 North Macedonia
-
 Norway
-
 Oman
-
 Pakistan
-
 Palestine
-
 Panama
-
 Papua New Guinea
-
 Paraguay
-
 Peru
-
 Philippines
-
 Poland
-
 Portugal
-
 Puerto Rico
-
 Qatar
-
 Reunion
-
 Romania
-
 Rwanda
-
 Saudi Arabia
-
 Serbia
-
 Singapore
-
 Slovakia
-
 Slovenia
-
 Somalia
-
 South Africa
-
 Spain
-
 Sri Lanka
-
 Sweden
-
 Switzerland
-
 Syria
-
 Taiwan
-
 Tajikistan
-
 Tanzania
-
 Thailand
-
 Trinidad and Tobago
-
 Tunisia
-
 Turkey
-
 UAE
-
 Uganda
-
 Ukraine
-
 United Kingdom
-
United States
-
 Uruguay
-
 Uzbekistan
-
 Venezuela
-
 Vietnam
-
 Yemen
-
 Zambia
-
 Zimbabwe
- Forex
- Crypto












