


Barclays PLC (BARC) dropped 2.27% as persistent technical weakness and ongoing selling pressure dominated trading, even as strong quarterly results and a major share buyback provided a positive backdrop. The move is strongly supported by the stock's position below its 20-day, 50-day, and 200-day moving averages, confirming the intensity of the downward momentum.
 426.85
434.80
Highlights
- Barclays reported third quarter income of £7.4 billion, with profit before tax up 12% to £2.3 billion.
- The bank announced a £500 million share buyback and plans to cut about 5,000 jobs for efficiency.
- Barclays stock trades below key moving averages with technical indicators deeply oversold, targeting a GBX390.97 to GBX409.32 range in the next five days.
Shareholder payouts and job cuts underscored by continued selling pressure
Barclays reported a 3% year-on-year rise in income to £7.4 billion and a 12% increase in profit before tax to £2.3 billion for the third quarter of 2026. The bank announced a £500 million share buyback, bringing total year-to-date shareholder distributions to £2.8 billion. Return on tangible equity reached 11.7% for the quarter, with equities trading revenue up 47% and fixed income revenue down 19%, alongside plans to cut approximately 5,000 jobs as part of efficiency measures, though price action has remained under broader selling pressure.
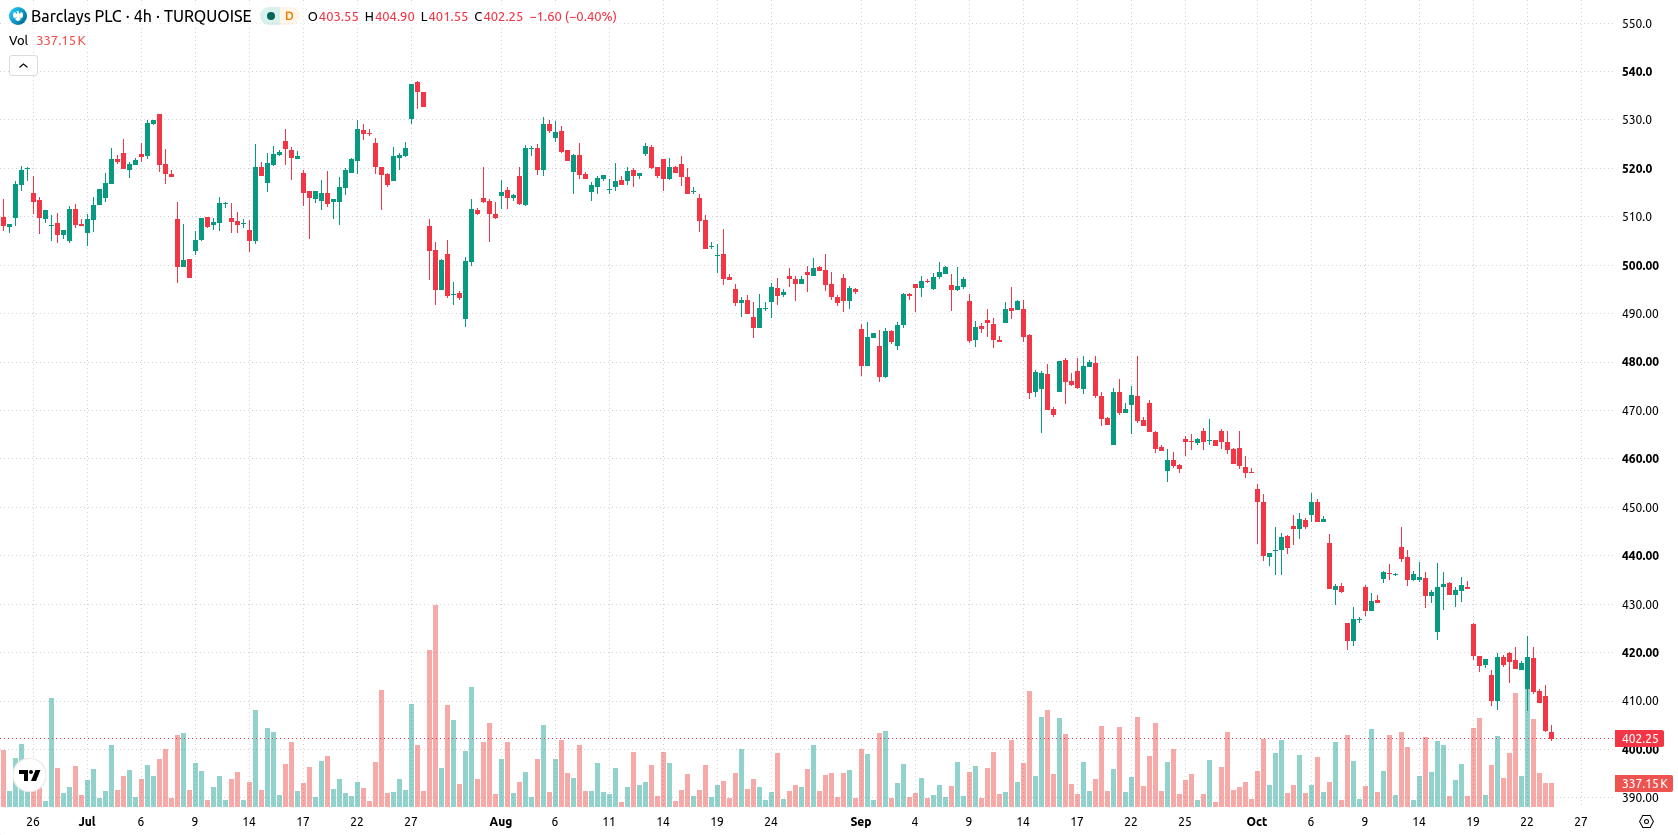
Entrenched downside momentum as technical barriers intensify oversold signals
Barclays stock is trading below its 20-day, 50-day, and 200-day moving averages (GBX437.23, GBX468.04, GBX464.5), signaling persistent selling pressure across short-, medium-, and long-term horizons. The prevailing technical structure is confirmed by a bullish alignment between the 50-day and 200-day averages. However, resistance from the Ichimoku Kijun (GBX444.45) remains substantial, with near-term focus on the GBX405.9 ceiling and GBX390.97 floor. Momentum signals are firmly negative: the MACD and ADX both indicate ongoing downside. The RSI at 23.9, Stochastic RSI at 0, and CCI at -130.25 all show deeply oversold conditions. Bear Power (BBP) is negative at -5.56, reflecting intraday selling dominance, reinforced by a negative Awesome Oscillator.
Earlier, analysts noted that Barclays’ operational improvements and profit growth continued to be overshadowed by sustained technical weakness and downside risk. The latest trading session reinforces this bearish technical narrative, and traders should now monitor GBX409.32 and GBX390.97 as the key breakout and breakdown levels that could define the next market direction.










-
 Afghanistan
-
 Albania
-
 Algeria
-
 Angola
-
 Argentina
-
 Armenia
-
 Australia
-
 Austria
-
 Azerbaijan
-
 Bahamas
-
 Bahrain
-
 Bangladesh
-
 Belarus
-
 Belgium
-
 Bolivia
-
 Botswana
-
 Brazil
-
 Brunei
-
 Bulgaria
-
 Cambodia
-
 Cameroon
-
 Canada
-
 Chile
-
 China
-
 Colombia
-
 Congo
-
 Costa Rica
-
 Cote d'Ivoire
-
 Croatia
-
 Cuba
-
 Cyprus
-
 Czechia
-
 DR Congo
-
 Denmark
-
 Dominican Republic
-
 Ecuador
-
 Egypt
-
 El Salvador
-
 Estonia
-
 Eswatini
-
 Ethiopia
-
 Finland
-
 France
-
 Georgia
-
 Germany
-
 Ghana
-
 Greece
-
 Haiti
-
 Hong Kong
-
 Hungary
-
 India
-
 Indonesia
-
 Iran, Islamic republic
-
 Iraq
-
 Ireland
-
 Israel
-
 Italy
-
 Jamaica
-
 Japan
-
 Jordan
-
 Kazakhstan
-
 Kenya
-
 Korea
-
 Kuwait
-
 Kyrgyzstan
-
 Laos
-
 Latvia
-
 Lebanon
-
 Lesotho
-
 Libya
-
 Lithuania
-
 Luxembourg
-
 Madagascar
-
 Malaysia
-
 Malta
-
 Mauritius
-
 Mexico
-
 Moldova
-
 Mongolia
-
 Montenegro
-
 Morocco
-
 Mozambique
-
 Myanmar
-
 Namibia
-
 Nepal
-
 Netherlands
-
 New Zealand
-
 Nigeria
-
 North Macedonia
-
 Norway
-
 Oman
-
 Pakistan
-
 Palestine
-
 Panama
-
 Papua New Guinea
-
 Paraguay
-
 Peru
-
 Philippines
-
 Poland
-
 Portugal
-
 Puerto Rico
-
 Qatar
-
 Reunion
-
 Romania
-
 Rwanda
-
 Saudi Arabia
-
 Serbia
-
 Singapore
-
 Slovakia
-
 Slovenia
-
 Somalia
-
 South Africa
-
 Spain
-
 Sri Lanka
-
 Sweden
-
 Switzerland
-
 Syria
-
 Taiwan
-
 Tajikistan
-
 Tanzania
-
 Thailand
-
 Trinidad and Tobago
-
 Tunisia
-
 Turkey
-
 UAE
-
 Uganda
-
 Ukraine
-
 United Kingdom
-
United States
-
 Uruguay
-
 Uzbekistan
-
 Venezuela
-
 Vietnam
-
 Yemen
-
 Zambia
-
 Zimbabwe
- Forex
- Crypto












