

Apple stock remains flat as consolidation forms above $343.53 support

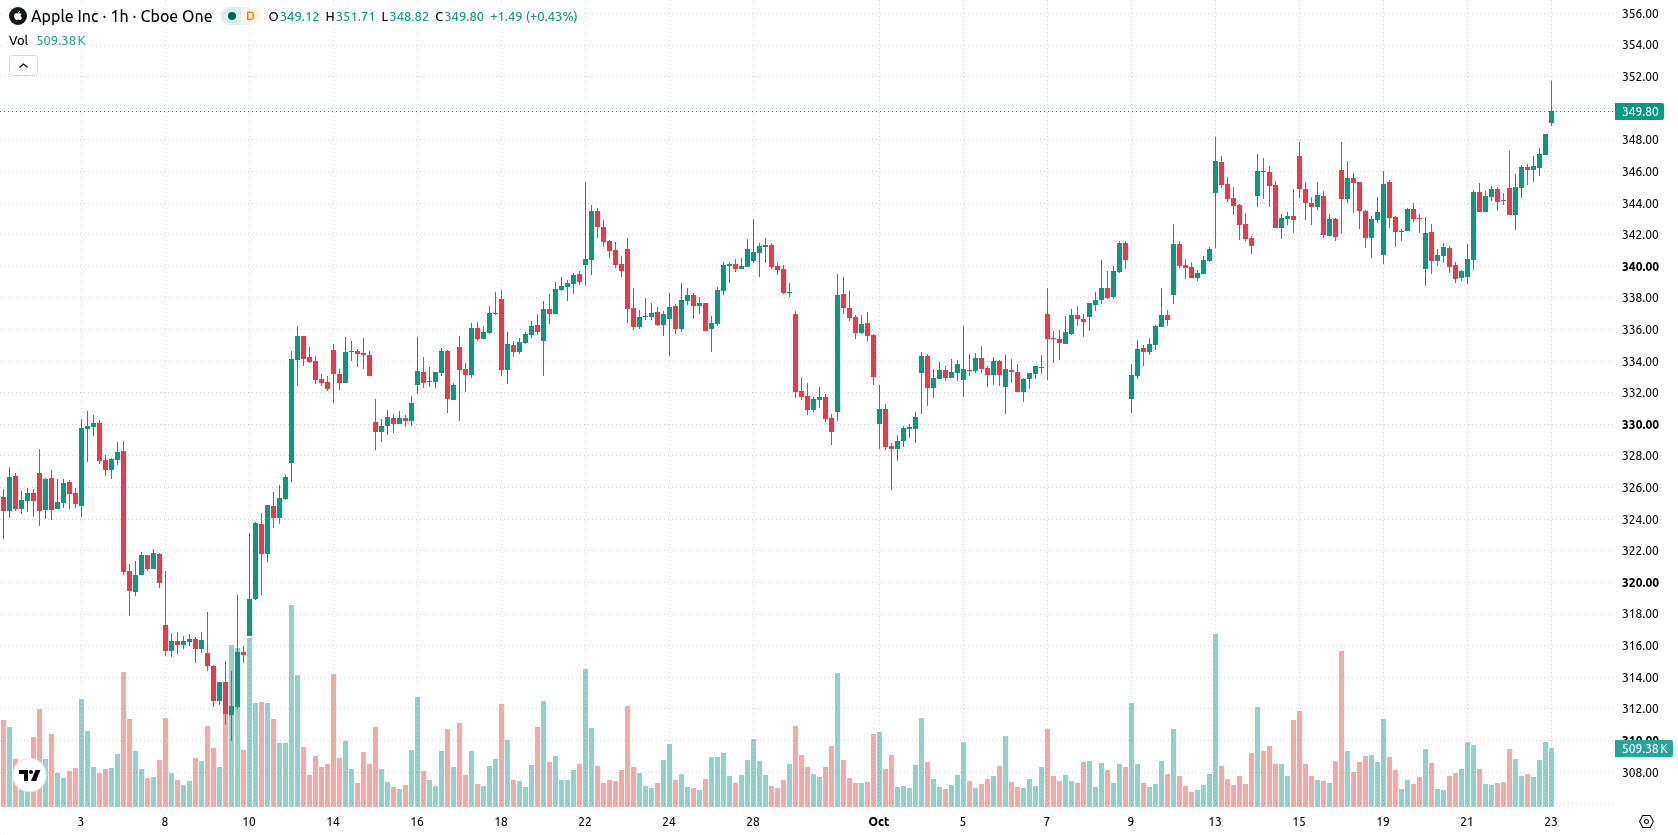
Apple Inc. (AAPL) stock is trading at $349.41 after a modest gain for the session. The price remains above its key moving averages, reflecting a continuation of bullish momentum.
 349.18
350.58
Highlights
- Apple stock reached a record high of $348.25, pushing market capitalization to approximately $5.07 trillion.
- New all-time highs attract institutional and retail flows, strengthening the perception of Apple stock's stability and growth potential.
- Strong bullish momentum persists with indicators overbought and price forecast to consolidate in the $345.15 to $353.67 range.
Record high and rising market cap reinforce stability perception
Apple Inc. stock reached a new all-time high of $348.25 with its market capitalization rising to about $5.07 trillion, according to Investing.com. Setting a record high often attracts both institutional and retail interest, reinforcing the company's perceived stability and growth prospects. This milestone serves as a reference point for market participants, underpinning both current positioning and future expectations.
Momentum dominance sustained as overbought signals flag pullback risk
On the technical front, AAPL is trading well above its MA-20 and MA-50 on the h1 chart, with the price also positioned above MA-200 on the daily timeframe. The Ichimoku Kijun at $343.53 now serves as immediate support. Intraday momentum is confirmed by MACD and ADX both in Buy mode, while RSI, Stochastic RSI, CCI, and Bull/Bear Power all reflect overbought conditions and clear buyer dominance. The Awesome Oscillator is consistent with the prevailing upward trend, although the confluence of overbought signals increases the probability of a short-term pullback.
Upward bias likely as consolidation expected above key support
Looking ahead, AAPL is likely to trade within the $345.15 to $353.67 volatility band over the next several sessions. The probability of a continued upward move is very high within this range, while the risk of a meaningful pullback remains low. The baseline expectation is for consolidation above immediate support, with a break above resistance offering room for additional gains; only a sustained move beneath the Kijun level would indicate a bearish scenario.
Previously it was reported that Apple launched its first foldable iPhone marking a significant expansion into new product segments and driving speculation about its broader impact on the company's market position. With AAPL shares at record highs and robust technical signals supporting further consolidation, traders should monitor the $345.15 to $353.67 volatility band as the key range for near-term positioning.











-
 Afghanistan
-
 Albania
-
 Algeria
-
 Angola
-
 Argentina
-
 Armenia
-
 Australia
-
 Austria
-
 Azerbaijan
-
 Bahamas
-
 Bahrain
-
 Bangladesh
-
 Belarus
-
 Belgium
-
 Bolivia
-
 Botswana
-
 Brazil
-
 Brunei
-
 Bulgaria
-
 Cambodia
-
 Cameroon
-
 Canada
-
 Chile
-
 China
-
 Colombia
-
 Congo
-
 Costa Rica
-
 Cote d'Ivoire
-
 Croatia
-
 Cuba
-
 Cyprus
-
 Czechia
-
 DR Congo
-
 Denmark
-
 Dominican Republic
-
 Ecuador
-
 Egypt
-
 El Salvador
-
 Estonia
-
 Eswatini
-
 Ethiopia
-
 Finland
-
 France
-
 Georgia
-
 Germany
-
 Ghana
-
 Greece
-
 Haiti
-
 Hong Kong
-
 Hungary
-
 India
-
 Indonesia
-
 Iran, Islamic republic
-
 Iraq
-
 Ireland
-
 Israel
-
 Italy
-
 Jamaica
-
 Japan
-
 Jordan
-
 Kazakhstan
-
 Kenya
-
 Korea
-
 Kuwait
-
 Kyrgyzstan
-
 Laos
-
 Latvia
-
 Lebanon
-
 Lesotho
-
 Libya
-
 Lithuania
-
 Luxembourg
-
 Madagascar
-
 Malaysia
-
 Malta
-
 Mauritius
-
 Mexico
-
 Moldova
-
 Mongolia
-
 Montenegro
-
 Morocco
-
 Mozambique
-
 Myanmar
-
 Namibia
-
 Nepal
-
 Netherlands
-
 New Zealand
-
 Nigeria
-
 North Macedonia
-
 Norway
-
 Oman
-
 Pakistan
-
 Palestine
-
 Panama
-
 Papua New Guinea
-
 Paraguay
-
 Peru
-
 Philippines
-
 Poland
-
 Portugal
-
 Puerto Rico
-
 Qatar
-
 Reunion
-
 Romania
-
 Rwanda
-
 Saudi Arabia
-
 Serbia
-
 Singapore
-
 Slovakia
-
 Slovenia
-
 Somalia
-
 South Africa
-
 Spain
-
 Sri Lanka
-
 Sweden
-
 Switzerland
-
 Syria
-
 Taiwan
-
 Tajikistan
-
 Tanzania
-
 Thailand
-
 Trinidad and Tobago
-
 Tunisia
-
 Turkey
-
 UAE
-
 Uganda
-
 Ukraine
-
 United Kingdom
-
United States
-
 Uruguay
-
 Uzbekistan
-
 Venezuela
-
 Vietnam
-
 Yemen
-
 Zambia
-
 Zimbabwe
- Forex
- Crypto












