

Will Royal Bank of Canada stock recover as buyers defend against recent volatility?

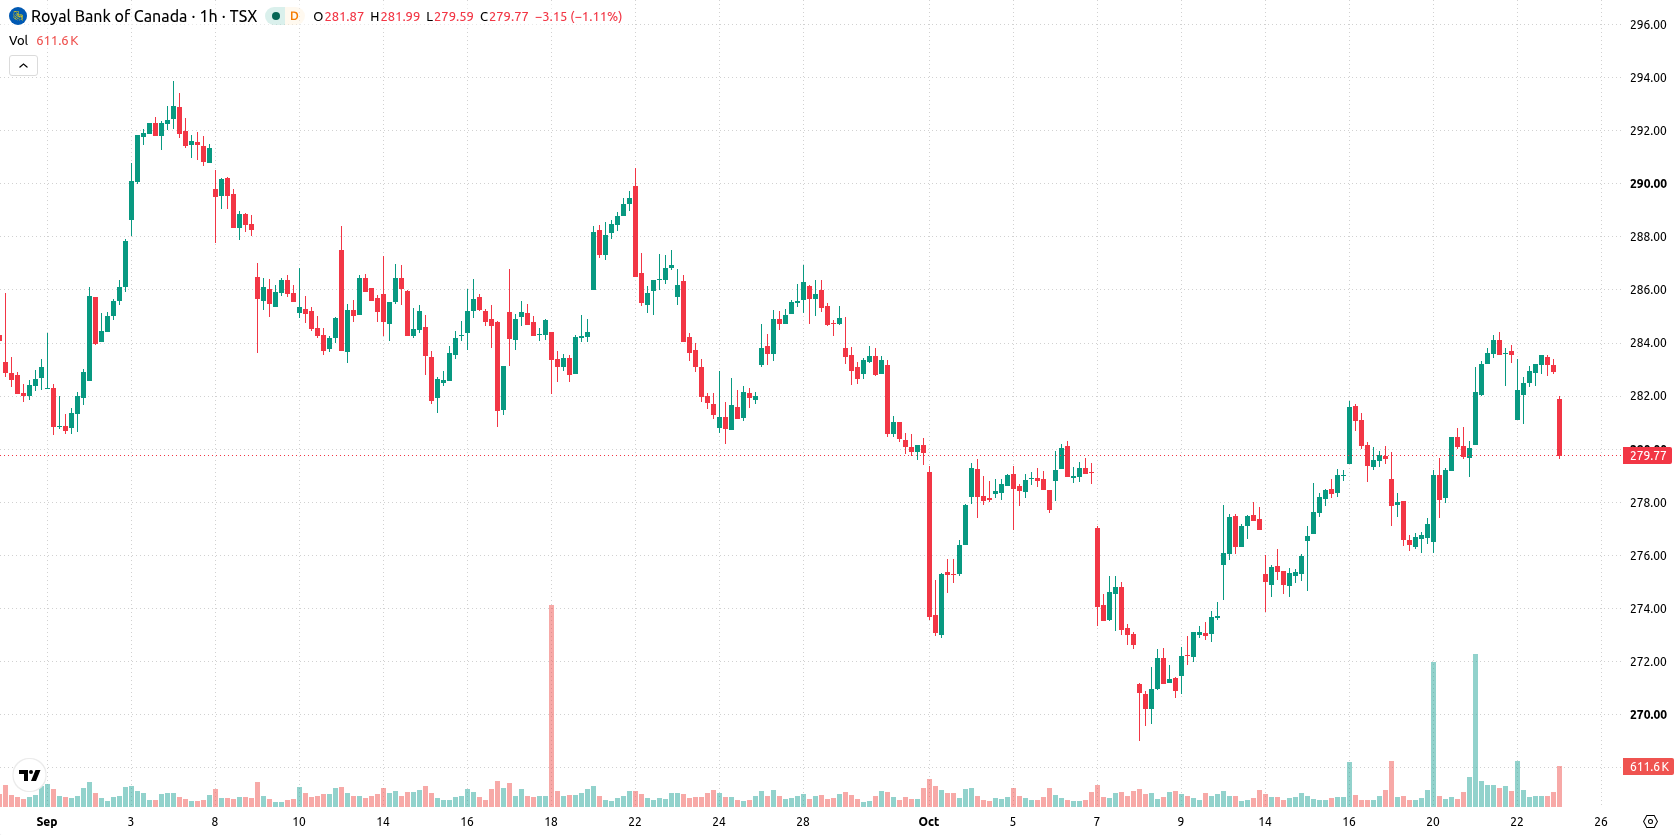
Royal Bank of Canada (RY) stock is trading at C$279.64, down 1.11% on the day. The price sits below short-term averages but continues to hold above key longer-term moving averages.
 269.00
289.78
Highlights
- RBC Investor Services was named service provider for four new NEI Investments ETF series trading on the Toronto Stock Exchange from October 22, 2026.
- Royal Bank of Canada's capital markets division appointed Sara Mahaffy as head of Canadian equity strategy, potentially shaping its domestic equities approach.
- RY/CAD remains volatile within a projected C$275.91 to C$284.71 range as technical indicators signal near-term selling but long-term accumulation.
ETF role expansion and leadership shift amid stock pressure
RBC Investor Services, a division of Royal Bank of Canada, was named service provider for four new ETF series launched by NEI Investments that began trading on the Toronto Stock Exchange on October 22, 2026, according to Financialpost. This appointment extends RBC's role in the ETF servicing sector and could enhance related revenue through increased product activity. In addition, Royal Bank of Canada's capital markets division appointed Sara Mahaffy as head of Canadian equity strategy, a change reported by Bloomberg that may shape the firm's domestic equities approach. These developments have emerged amid ongoing selling pressure on the stock.
Bullish momentum emerges as mixed signals test resistance
Technically, RY is trading below the MA-20 at C$282.08, above the MA-50 at C$279.46 on the hourly chart, and remains well above the MA-200 at C$261.28 on the daily timeframe. The Ichimoku Kijun level at C$280.23 represents immediate resistance. Momentum readings are mixed: MACD shows strong bullish momentum, while ADX is neutral; RSI signals a buy near 59, Stochastic RSI is in oversold territory, and CCI is neutral. Bull/Bear Power favors buyers intraday and is supported by the Awesome Oscillator’s buy signal, although oscillator divergence and volatility suggest underlying accumulation against recent weakness.
Upside bias remains as volatility sets trading boundaries
In the near term, RY is expected to trade within a C$275.91 to C$284.71 volatility band. There is a 70% probability of further upside, with the baseline scenario suggesting RY will remain in this corridor amid continued volatility. A sustained move above C$280.23 could bring the upper end of the range into play, while a drop below C$275.91 may open the way for additional downside, though this is considered less likely.
Earlier, analysts noted that Royal Bank of Canada shares were consolidating with positive technical momentum and potential for further upside. The current analysis adds new dimensions by factoring in recent corporate developments and mixed technical signals, highlighting C$280.23 as a pivotal resistance level to monitor for near-term price direction.










-
 Afghanistan
-
 Albania
-
 Algeria
-
 Angola
-
 Argentina
-
 Armenia
-
 Australia
-
 Austria
-
 Azerbaijan
-
 Bahamas
-
 Bahrain
-
 Bangladesh
-
 Belarus
-
 Belgium
-
 Bolivia
-
 Botswana
-
 Brazil
-
 Brunei
-
 Bulgaria
-
 Cambodia
-
 Cameroon
-
 Canada
-
 Chile
-
 China
-
 Colombia
-
 Congo
-
 Costa Rica
-
 Cote d'Ivoire
-
 Croatia
-
 Cuba
-
 Cyprus
-
 Czechia
-
 DR Congo
-
 Denmark
-
 Dominican Republic
-
 Ecuador
-
 Egypt
-
 El Salvador
-
 Estonia
-
 Eswatini
-
 Ethiopia
-
 Finland
-
 France
-
 Georgia
-
 Germany
-
 Ghana
-
 Greece
-
 Haiti
-
 Hong Kong
-
 Hungary
-
 India
-
 Indonesia
-
 Iran, Islamic republic
-
 Iraq
-
 Ireland
-
 Israel
-
 Italy
-
 Jamaica
-
 Japan
-
 Jordan
-
 Kazakhstan
-
 Kenya
-
 Korea
-
 Kuwait
-
 Kyrgyzstan
-
 Laos
-
 Latvia
-
 Lebanon
-
 Lesotho
-
 Libya
-
 Lithuania
-
 Luxembourg
-
 Madagascar
-
 Malaysia
-
 Malta
-
 Mauritius
-
 Mexico
-
 Moldova
-
 Mongolia
-
 Montenegro
-
 Morocco
-
 Mozambique
-
 Myanmar
-
 Namibia
-
 Nepal
-
 Netherlands
-
 New Zealand
-
 Nigeria
-
 North Macedonia
-
 Norway
-
 Oman
-
 Pakistan
-
 Palestine
-
 Panama
-
 Papua New Guinea
-
 Paraguay
-
 Peru
-
 Philippines
-
 Poland
-
 Portugal
-
 Puerto Rico
-
 Qatar
-
 Reunion
-
 Romania
-
 Rwanda
-
 Saudi Arabia
-
 Serbia
-
 Singapore
-
 Slovakia
-
 Slovenia
-
 Somalia
-
 South Africa
-
 Spain
-
 Sri Lanka
-
 Sweden
-
 Switzerland
-
 Syria
-
 Taiwan
-
 Tajikistan
-
 Tanzania
-
 Thailand
-
 Trinidad and Tobago
-
 Tunisia
-
 Turkey
-
 UAE
-
 Uganda
-
 Ukraine
-
 United Kingdom
-
United States
-
 Uruguay
-
 Uzbekistan
-
 Venezuela
-
 Vietnam
-
 Yemen
-
 Zambia
-
 Zimbabwe
- Forex
- Crypto












