

Royal Bank of Canada stock consolidates amid overbought conditions and strong buyer support

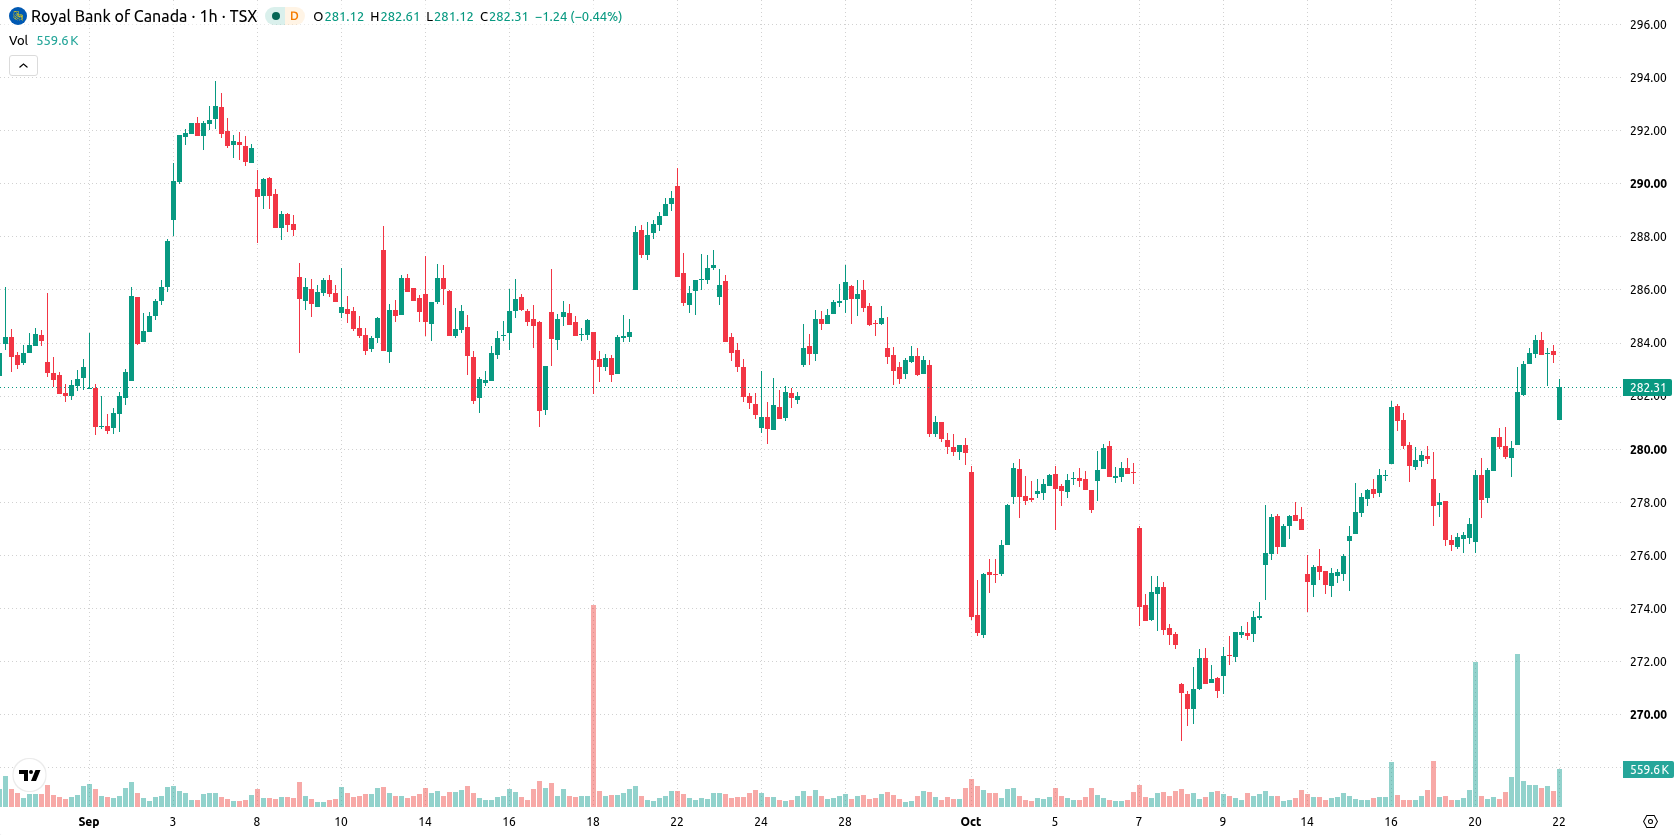
Royal Bank of Canada (RY) stock is trading at C$283.08, marking a modest dip for the session. The price remains above its key moving averages, suggesting the stock continues to hold strength relative to recent trends.
 285.00
291.19
Highlights
- Royal Bank of Canada stock gained for two consecutive sessions on October 20 and 21, 2026, drawing renewed investor interest.
- The recent share price advances contributed to broader gains across Canadian bank stocks, attracting institutional buyers to the sector.
- Technical signals show a bullish trend for RY, with a projected 2 to 3 session range of C$279.35 to C$286.81 and momentum overbought short term.
Institutional buying accelerates as sector sentiment turns supportive
Royal Bank of Canada posted a share price gain on October 20, 2026, which, according to Kalkine, signaled renewed investor interest following recent company developments. This was followed by another positive session on October 21, 2026, extending gains and contributing to broader strength across Canadian bank shares, as reported by Thecanadianvanguard. The consecutive days of upward movement for Royal Bank of Canada highlight a period of supportive sentiment within the financial sector and may encourage ongoing participation from institutional buyers.
Overbought momentum intensifies as price tests resistance near highs
On the hourly chart, RY trades above the MA-20 at C$280.1 and MA-50 at C$278.57, and remains well above the long-term MA-200 at C$261.04. The Ichimoku Kijun level at C$280.23 offers immediate support. Momentum indicators, including MACD and ADX, signal ongoing upward momentum, while readings from RSI at 69.1, Stoch RSI, CCI, and Bull/Bear Power all reflect an overbought and strongly buyer-dominated environment. The Awesome Oscillator remains neutral and does not reinforce the broader bullish signal. Today’s intraday move saw a negative gap of C$3.45, with moderate volatility and price action clustered near session highs, suggesting a potential for short-term exhaustion.
Volatility range narrows as momentum steadies and risk skews higher
Looking ahead to the next two to three sessions, RY is expected to trade within the C$279.35 to C$286.81 range, reflecting a volatility band relative to current levels. There is a 76% probability of an upside move and 24% chance of decline. The baseline scenario sees price consolidating within this range as strong momentum steadies, while a break above C$286.81 would open room for further gains. Conversely, a drop below C$279.35 would indicate a decisive loss of near-term support and could prompt deeper corrective action.
Earlier, analysts noted that Royal Bank of Canada shares were consolidating with positive technical momentum and potential for further upside. The current analysis strengthens this outlook by highlighting continued upward trading, with traders advised to monitor the C$286.81 level as a potential pivot for near-term price direction.










-
 Afghanistan
-
 Albania
-
 Algeria
-
 Angola
-
 Argentina
-
 Armenia
-
 Australia
-
 Austria
-
 Azerbaijan
-
 Bahamas
-
 Bahrain
-
 Bangladesh
-
 Belarus
-
 Belgium
-
 Bolivia
-
 Botswana
-
 Brazil
-
 Brunei
-
 Bulgaria
-
 Cambodia
-
 Cameroon
-
 Canada
-
 Chile
-
 China
-
 Colombia
-
 Congo
-
 Costa Rica
-
 Cote d'Ivoire
-
 Croatia
-
 Cuba
-
 Cyprus
-
 Czechia
-
 DR Congo
-
 Denmark
-
 Dominican Republic
-
 Ecuador
-
 Egypt
-
 El Salvador
-
 Estonia
-
 Eswatini
-
 Ethiopia
-
 Finland
-
 France
-
 Georgia
-
 Germany
-
 Ghana
-
 Greece
-
 Haiti
-
 Hong Kong
-
 Hungary
-
 India
-
 Indonesia
-
 Iran, Islamic republic
-
 Iraq
-
 Ireland
-
 Israel
-
 Italy
-
 Jamaica
-
 Japan
-
 Jordan
-
 Kazakhstan
-
 Kenya
-
 Korea
-
 Kuwait
-
 Kyrgyzstan
-
 Laos
-
 Latvia
-
 Lebanon
-
 Lesotho
-
 Libya
-
 Lithuania
-
 Luxembourg
-
 Madagascar
-
 Malaysia
-
 Malta
-
 Mauritius
-
 Mexico
-
 Moldova
-
 Mongolia
-
 Montenegro
-
 Morocco
-
 Mozambique
-
 Myanmar
-
 Namibia
-
 Nepal
-
 Netherlands
-
 New Zealand
-
 Nigeria
-
 North Macedonia
-
 Norway
-
 Oman
-
 Pakistan
-
 Palestine
-
 Panama
-
 Papua New Guinea
-
 Paraguay
-
 Peru
-
 Philippines
-
 Poland
-
 Portugal
-
 Puerto Rico
-
 Qatar
-
 Reunion
-
 Romania
-
 Rwanda
-
 Saudi Arabia
-
 Serbia
-
 Singapore
-
 Slovakia
-
 Slovenia
-
 Somalia
-
 South Africa
-
 Spain
-
 Sri Lanka
-
 Sweden
-
 Switzerland
-
 Syria
-
 Taiwan
-
 Tajikistan
-
 Tanzania
-
 Thailand
-
 Trinidad and Tobago
-
 Tunisia
-
 Turkey
-
 UAE
-
 Uganda
-
 Ukraine
-
 United Kingdom
-
United States
-
 Uruguay
-
 Uzbekistan
-
 Venezuela
-
 Vietnam
-
 Yemen
-
 Zambia
-
 Zimbabwe
- Forex
- Crypto












