

GE Aerospace stock price prediction: Consolidation likely unless $270.6 support breaks

GE Aerospace (GE) stock is trading at $283.78 after a drop of 3.32% for the day, closing near its session low and under pressure. The price remains below its key moving averages, signaling a persistent downward trend across all timeframes.
 313.88
Highlights
- GE Aerospace reported third-quarter earnings of $2.25 per share with 25% revenue growth to $13.29 billion, surpassing analyst expectations.
- The company expanded its castings supply by completing an $11.75 billion acquisition of CPP, enabling greater scale for its operations and competitors.
- Shares of GE Aerospace closed at $283.78 after a 3.32% drop, with technicals indicating continued downside and an expected price range of $270.6 to $296.96 in the coming days.
Earnings beat and acquisition expand growth as selling persists
GE Aerospace reported third-quarter earnings of $2.25 per share, exceeding analyst expectations and highlighting the company's ongoing earnings strength, according to Globalbankingandfinance. Robust revenue growth of 25% year over year to $13.29 billion underscores sustained demand for engine maintenance and spare parts. The recent completion of GE Aerospace's $11.75 billion acquisition of CPP, as reported by Disruptionbanking, expands its castings supply capabilities for both its own operations and competitors, potentially setting the stage for greater scale advantages — though price action has remained under broader selling pressure.
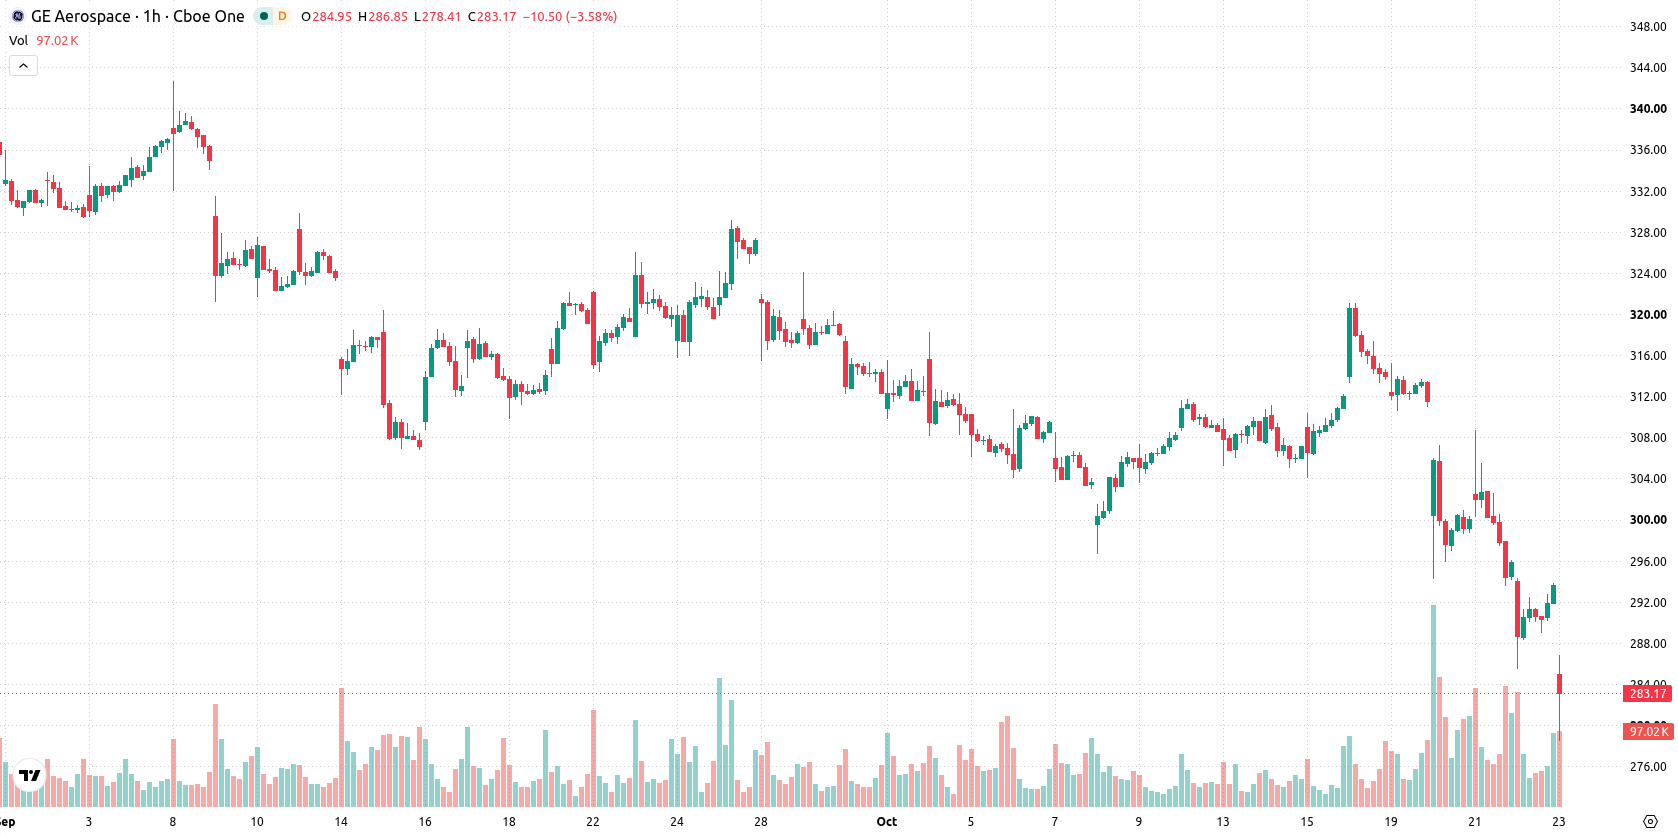
Bearish momentum dominates as resistance and indicators align negatively
On the h1 chart, GE is trading below the MA-20 and MA-50, while on the daily timeframe it remains well under the MA-200. The Ichimoku Kijun sits at $299.75, marking near-term resistance. Momentum indicators present a strongly negative profile: MACD signals Strong Sell, ADX confirms a selling trend, and RSI is weak at 38.94. In addition, CCI and Bull/Bear Power both indicate sellers are dominating. Despite this consensus, Stoch RSI stands in the overbought zone, highlighting a divergence in short-term oscillator sentiment and suggesting the possibility of intraday volatility.
Volatility band narrows with downside risk if support breaks
Over the next several trading days, GE is expected to fluctuate within a volatility band ranging from $270.6 to $296.96. The likelihood of a further downward move stands at 67%, with rebound probabilities at only 33%. Under the baseline scenario, price is likely to consolidate in this range, while a breakout above $299.75 would be required to shift momentum toward the upside. If support at $270.6 fails, a bearish scenario may accelerate further declines.
Previously it was reported that GE Aerospace's strong earnings and raised guidance were not enough to lift the stock from its prevailing downside momentum. The current article deepens this view with confirmation of continued technical weakness despite strategic expansion, highlighting $270.6 as the key support level to monitor for further downside risk.






Latest General Electric News





-
 Afghanistan
-
 Albania
-
 Algeria
-
 Angola
-
 Argentina
-
 Armenia
-
 Australia
-
 Austria
-
 Azerbaijan
-
 Bahamas
-
 Bahrain
-
 Bangladesh
-
 Belarus
-
 Belgium
-
 Bolivia
-
 Botswana
-
 Brazil
-
 Brunei
-
 Bulgaria
-
 Cambodia
-
 Cameroon
-
 Canada
-
 Chile
-
 China
-
 Colombia
-
 Congo
-
 Costa Rica
-
 Cote d'Ivoire
-
 Croatia
-
 Cuba
-
 Cyprus
-
 Czechia
-
 DR Congo
-
 Denmark
-
 Dominican Republic
-
 Ecuador
-
 Egypt
-
 El Salvador
-
 Estonia
-
 Eswatini
-
 Ethiopia
-
 Finland
-
 France
-
 Georgia
-
 Germany
-
 Ghana
-
 Greece
-
 Haiti
-
 Hong Kong
-
 Hungary
-
 India
-
 Indonesia
-
 Iran, Islamic republic
-
 Iraq
-
 Ireland
-
 Israel
-
 Italy
-
 Jamaica
-
 Japan
-
 Jordan
-
 Kazakhstan
-
 Kenya
-
 Korea
-
 Kuwait
-
 Kyrgyzstan
-
 Laos
-
 Latvia
-
 Lebanon
-
 Lesotho
-
 Libya
-
 Lithuania
-
 Luxembourg
-
 Madagascar
-
 Malaysia
-
 Malta
-
 Mauritius
-
 Mexico
-
 Moldova
-
 Mongolia
-
 Montenegro
-
 Morocco
-
 Mozambique
-
 Myanmar
-
 Namibia
-
 Nepal
-
 Netherlands
-
 New Zealand
-
 Nigeria
-
 North Macedonia
-
 Norway
-
 Oman
-
 Pakistan
-
 Palestine
-
 Panama
-
 Papua New Guinea
-
 Paraguay
-
 Peru
-
 Philippines
-
 Poland
-
 Portugal
-
 Puerto Rico
-
 Qatar
-
 Reunion
-
 Romania
-
 Rwanda
-
 Saudi Arabia
-
 Serbia
-
 Singapore
-
 Slovakia
-
 Slovenia
-
 Somalia
-
 South Africa
-
 Spain
-
 Sri Lanka
-
 Sweden
-
 Switzerland
-
 Syria
-
 Taiwan
-
 Tajikistan
-
 Tanzania
-
 Thailand
-
 Trinidad and Tobago
-
 Tunisia
-
 Turkey
-
 UAE
-
 Uganda
-
 Ukraine
-
 United Kingdom
-
United States
-
 Uruguay
-
 Uzbekistan
-
 Venezuela
-
 Vietnam
-
 Yemen
-
 Zambia
-
 Zimbabwe
- Forex
- Crypto












