

Home Depot shares technical analysis: Overbought conditions point to potential short-term reversal setup

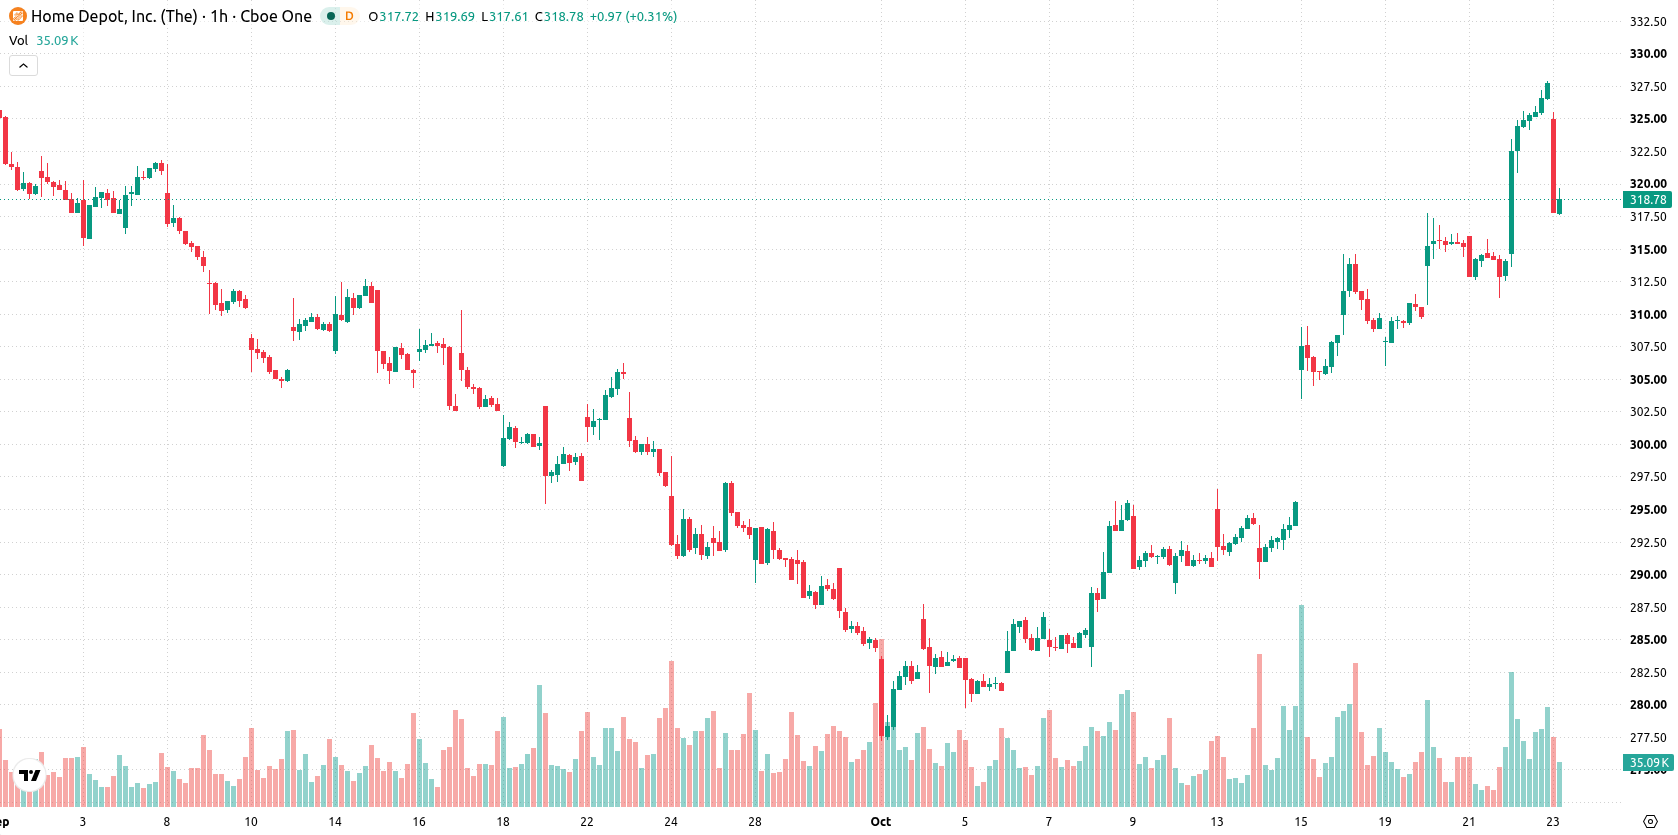
Home Depot (HD) stock is trading at $318.22, down 2.89% on the day. The price currently sits below its short-term averages while remaining above medium-term levels, but lags its long-term moving averages.
 329.01
Highlights
- Home Depot acquired a distributor serving large contractors, expanding its professional supply market presence.
- Easing interest rates have improved the outlook for Home Depot's core business and sustained contractor demand has stabilized revenues.
- Shares of Home Depot fell 2.89% with indicators showing strong short-term buying, but overbought signals and projected trading between $309.19 to $332.39 suggest risk of a near-term pullback.
Professional segment growth as acquisition and rates boost sentiment
Home Depot recently completed the acquisition of a distributor serving large contractors, which broadens its reach into the professional supply market and may strengthen future sales from this segment. According to Kalkinemedia, the backdrop for Home Depot's core business has improved as easing interest rates have revived expectations for a housing recovery, supporting renewed demand for home improvement. Steady contractor demand has helped stabilize revenue streams, though price action has remained under broader selling pressure.
Overbought signals emerge as price nears resistance band
On the technical front, HD is trading between the MA-20 at $318.35 and MA-50 at $310.38 on the H1 chart, while remaining well below the MA-200 at $335.71 on the daily timeframe. Immediate resistance is seen at the Ichimoku Kijun level of $318.36, with short-term support at $309.19 and higher resistance at $332.39. Momentum indicators on H1, such as MACD, ADX, and Awesome Oscillator, show buyer activity, but RSI at 82.14, Stochastic RSI, CCI, and Bull/Bear Power all signal overbought conditions, highlighting a risk of short-term pullback despite dominant buying.
Consolidation forecast as breakout probability favors upside
Over the next two to three trading days, HD is projected to consolidate within a volatility band of $309.19 to $332.39. The probability of an upward breakout is estimated at 58%. If price breaks above the $318.36 resistance, a trend extension could materialize; a failure to hold the $309.19 level may prompt further downside within the current range.
Earlier, analysts noted that while Home Depot stock was showing upside momentum, near-term risks remained due to technical resistance and institutional outflows. The current analysis adds a new dimension by highlighting potential for range-bound consolidation in light of recent acquisition-driven growth, with $318.36 now serving as a pivotal resistance level for traders to watch.






Latest Home Depot News



-
 Afghanistan
-
 Albania
-
 Algeria
-
 Angola
-
 Argentina
-
 Armenia
-
 Australia
-
 Austria
-
 Azerbaijan
-
 Bahamas
-
 Bahrain
-
 Bangladesh
-
 Belarus
-
 Belgium
-
 Bolivia
-
 Botswana
-
 Brazil
-
 Brunei
-
 Bulgaria
-
 Cambodia
-
 Cameroon
-
 Canada
-
 Chile
-
 China
-
 Colombia
-
 Congo
-
 Costa Rica
-
 Cote d'Ivoire
-
 Croatia
-
 Cuba
-
 Cyprus
-
 Czechia
-
 DR Congo
-
 Denmark
-
 Dominican Republic
-
 Ecuador
-
 Egypt
-
 El Salvador
-
 Estonia
-
 Eswatini
-
 Ethiopia
-
 Finland
-
 France
-
 Georgia
-
 Germany
-
 Ghana
-
 Greece
-
 Haiti
-
 Hong Kong
-
 Hungary
-
 India
-
 Indonesia
-
 Iran, Islamic republic
-
 Iraq
-
 Ireland
-
 Israel
-
 Italy
-
 Jamaica
-
 Japan
-
 Jordan
-
 Kazakhstan
-
 Kenya
-
 Korea
-
 Kuwait
-
 Kyrgyzstan
-
 Laos
-
 Latvia
-
 Lebanon
-
 Lesotho
-
 Libya
-
 Lithuania
-
 Luxembourg
-
 Madagascar
-
 Malaysia
-
 Malta
-
 Mauritius
-
 Mexico
-
 Moldova
-
 Mongolia
-
 Montenegro
-
 Morocco
-
 Mozambique
-
 Myanmar
-
 Namibia
-
 Nepal
-
 Netherlands
-
 New Zealand
-
 Nigeria
-
 North Macedonia
-
 Norway
-
 Oman
-
 Pakistan
-
 Palestine
-
 Panama
-
 Papua New Guinea
-
 Paraguay
-
 Peru
-
 Philippines
-
 Poland
-
 Portugal
-
 Puerto Rico
-
 Qatar
-
 Reunion
-
 Romania
-
 Rwanda
-
 Saudi Arabia
-
 Serbia
-
 Singapore
-
 Slovakia
-
 Slovenia
-
 Somalia
-
 South Africa
-
 Spain
-
 Sri Lanka
-
 Sweden
-
 Switzerland
-
 Syria
-
 Taiwan
-
 Tajikistan
-
 Tanzania
-
 Thailand
-
 Trinidad and Tobago
-
 Tunisia
-
 Turkey
-
 UAE
-
 Uganda
-
 Ukraine
-
 United Kingdom
-
United States
-
 Uruguay
-
 Uzbekistan
-
 Venezuela
-
 Vietnam
-
 Yemen
-
 Zambia
-
 Zimbabwe
- Forex
- Crypto












