

Mohawk Industries stock falls around 3.5% as investors cool on robust earnings momentum

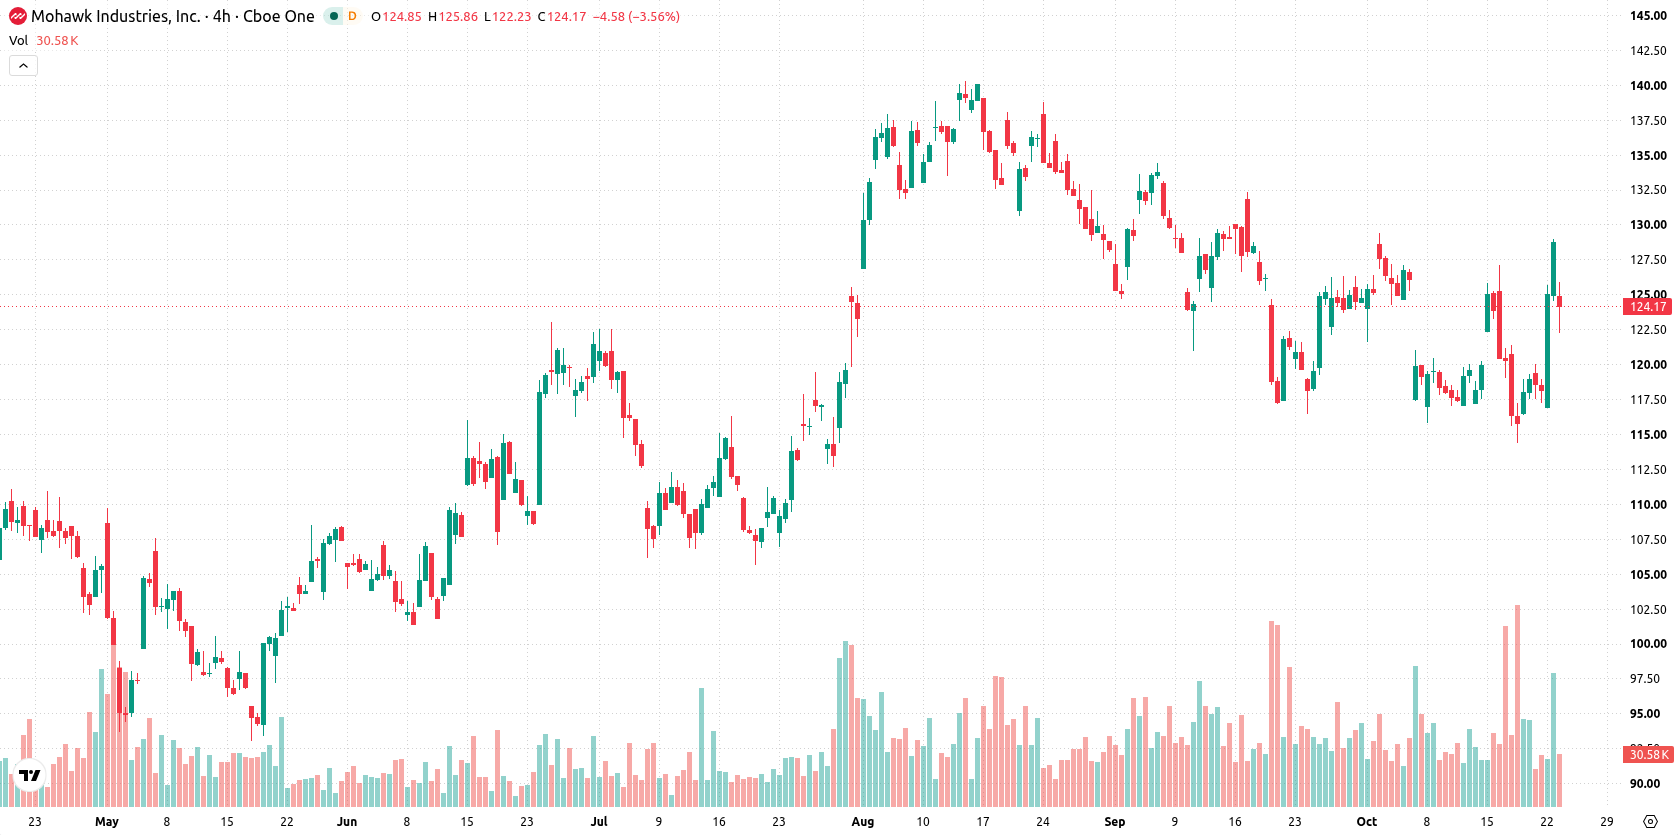
Mohawk Industries, Inc. (MHK) dropped 3.48% after recent robust earnings momentum failed to maintain investor optimism ahead of its scheduled third quarter 2026 earnings release. The correction looks limited, with Mohawk trading above both its 20-day and 200-day moving averages, while medium-term resistance near the 50-day level is constraining further declines.
 140.22
Highlights
- Mohawk Industries will release third quarter 2026 results after the close on October 29, following recent periods of strong revenue and profit growth.
- Analysts have commended Mohawk Industries for its operational and financial performance, though the stock has traded under broad selling pressure.
- Shares of Mohawk last traded at $124.22 with mixed momentum indicators and are projected to trade between $116.98 and $131.45 over the next five sessions.
Strong growth and analyst praise offset by broad market selling
Mohawk Industries is set to report its third quarter 2026 results after the close on October 29. The company recorded strong revenue and profit growth in recent periods, attributed to higher sales volumes, improved pricing, and a favorable product mix. Mohawk has been commended for its operational and financial performance by several analysts in the sector, though price action has remained under broader selling pressure.
Short-term support holds as momentum indicators diverge near resistance
Mohawk is trading above its 20-day moving average ($122.06) and its 200-day moving average ($115.98), but remains below the 50-day moving average ($126.57). This structure suggests short-term support and a positive long-term setup, but medium-term resistance persists around the 50-day mark. The Ichimoku Kijun at $123.43 marks immediate support, with $125.58 acting as near-term resistance. Momentum signals are mixed: MACD issues a Strong Sell, highlighting declining momentum, but ADX, RSI, and CCI remain bullish or in buy territory. Stochastic RSI and Bull/Bear Power both indicate overbought conditions, with BBP’s positive value confirming that buyers are active intraday. Intraday volatility measures 2.74%, and the price is currently in the session’s middle range, with divergence across momentum and oscillator signals suggesting a mixed short-term outlook.
Earlier, analysts noted that Mohawk Industries was under persistent short- and medium-term selling pressure despite retaining a supportive long-term trend. The current technical setup presents a more balanced risk profile, with mixed indicator signals suggesting the stock may remain rangebound unless a decisive move above $125.58 or below $123.43 materializes.






Latest Mohawk Industries News




-
 Afghanistan
-
 Albania
-
 Algeria
-
 Angola
-
 Argentina
-
 Armenia
-
 Australia
-
 Austria
-
 Azerbaijan
-
 Bahamas
-
 Bahrain
-
 Bangladesh
-
 Belarus
-
 Belgium
-
 Bolivia
-
 Botswana
-
 Brazil
-
 Brunei
-
 Bulgaria
-
 Cambodia
-
 Cameroon
-
 Canada
-
 Chile
-
 China
-
 Colombia
-
 Congo
-
 Costa Rica
-
 Cote d'Ivoire
-
 Croatia
-
 Cuba
-
 Cyprus
-
 Czechia
-
 DR Congo
-
 Denmark
-
 Dominican Republic
-
 Ecuador
-
 Egypt
-
 El Salvador
-
 Estonia
-
 Eswatini
-
 Ethiopia
-
 Finland
-
 France
-
 Georgia
-
 Germany
-
 Ghana
-
 Greece
-
 Haiti
-
 Hong Kong
-
 Hungary
-
 India
-
 Indonesia
-
 Iran, Islamic republic
-
 Iraq
-
 Ireland
-
 Israel
-
 Italy
-
 Jamaica
-
 Japan
-
 Jordan
-
 Kazakhstan
-
 Kenya
-
 Korea
-
 Kuwait
-
 Kyrgyzstan
-
 Laos
-
 Latvia
-
 Lebanon
-
 Lesotho
-
 Libya
-
 Lithuania
-
 Luxembourg
-
 Madagascar
-
 Malaysia
-
 Malta
-
 Mauritius
-
 Mexico
-
 Moldova
-
 Mongolia
-
 Montenegro
-
 Morocco
-
 Mozambique
-
 Myanmar
-
 Namibia
-
 Nepal
-
 Netherlands
-
 New Zealand
-
 Nigeria
-
 North Macedonia
-
 Norway
-
 Oman
-
 Pakistan
-
 Palestine
-
 Panama
-
 Papua New Guinea
-
 Paraguay
-
 Peru
-
 Philippines
-
 Poland
-
 Portugal
-
 Puerto Rico
-
 Qatar
-
 Reunion
-
 Romania
-
 Rwanda
-
 Saudi Arabia
-
 Serbia
-
 Singapore
-
 Slovakia
-
 Slovenia
-
 Somalia
-
 South Africa
-
 Spain
-
 Sri Lanka
-
 Sweden
-
 Switzerland
-
 Syria
-
 Taiwan
-
 Tajikistan
-
 Tanzania
-
 Thailand
-
 Trinidad and Tobago
-
 Tunisia
-
 Turkey
-
 UAE
-
 Uganda
-
 Ukraine
-
 United Kingdom
-
United States
-
 Uruguay
-
 Uzbekistan
-
 Venezuela
-
 Vietnam
-
 Yemen
-
 Zambia
-
 Zimbabwe
- Forex
- Crypto












