

GSK stock holds steady amid consolidation near a key level

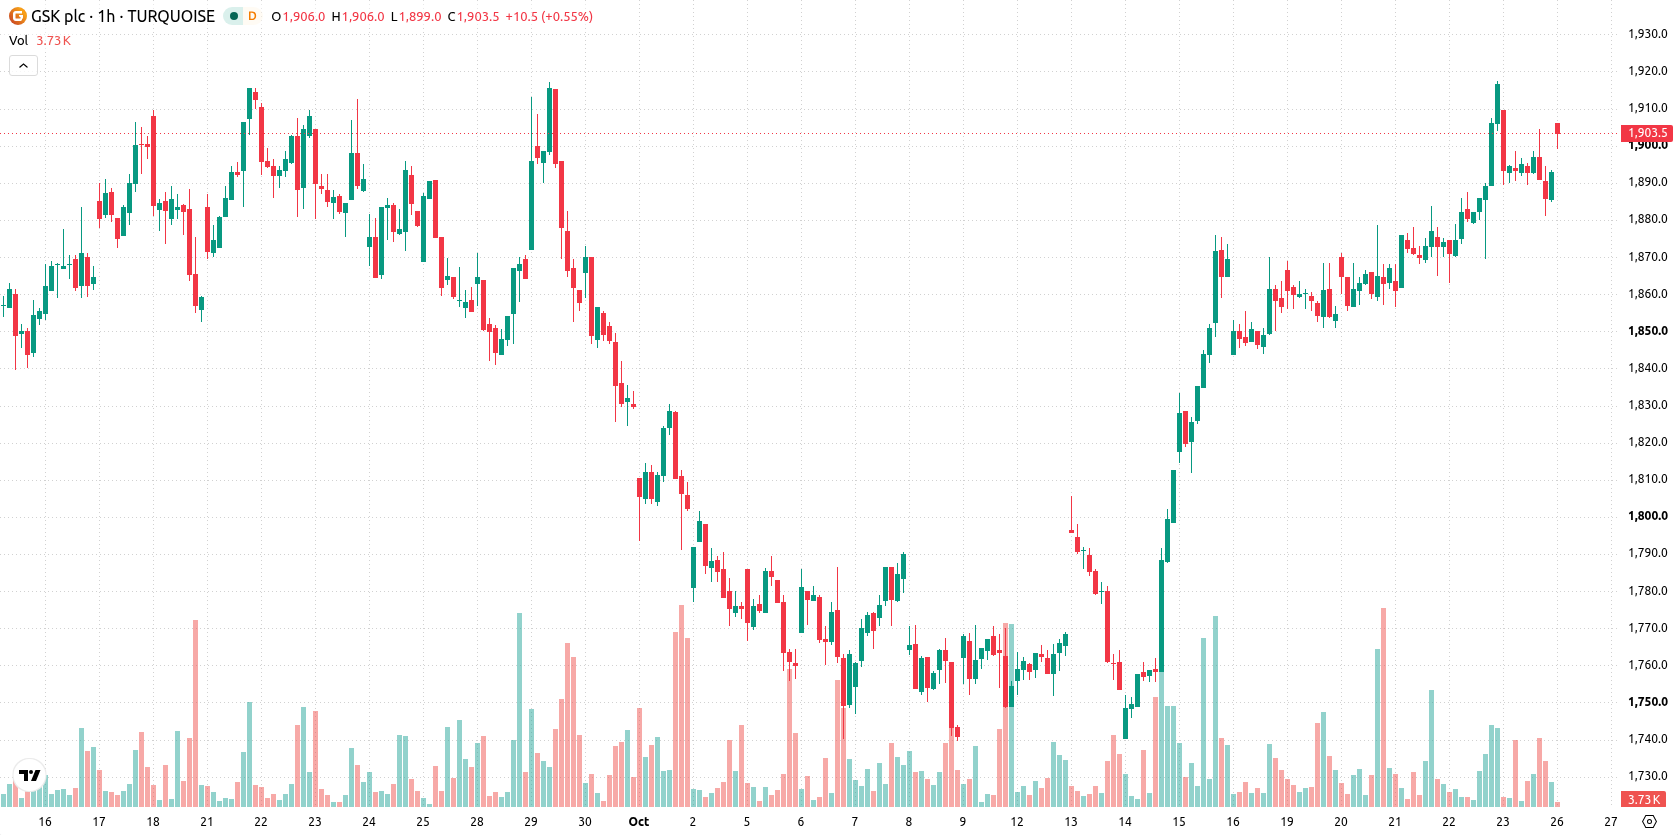
GSK (GSK) stock is trading at GBX1,909.50, up modestly for the session. The price currently sits above its key short- and medium-term moving averages, suggesting a positive tilt in near-term momentum.
 1890.00
1913.50
Highlights
- GSK stock is showing positive short- and medium-term momentum but remains under longer-term bearish pressure.
- Immediate support stands at GBX1,889, with the price closing at GBX1,909 and gaining 0.9% for the day.
- Price is likely to remain in the GBX1,880 to GBX1,937 range in the coming sessions, with breakout direction dependent on resistance or support levels.
Bullish momentum strengthened as MACD and ADX align above support
On the H1 timeframe, the stock is trading above the MA-20 (GBX1,888) and MA-50 (GBX1,872), but remains below the long-term MA-200 (GBX1,951). Immediate support is located at the Ichimoku Kijun level of GBX1,889. MACD has issued a strong buy signal while ADX indicates a buy, reflecting strong upside momentum. RSI stands at 55.96 (buy), with Stoch RSI in oversold territory, CCI holding neutral, and Bull/Bear Power showing overbought conditions—indicating a mix of bullish momentum and conflicting oscillator signals.
Range-bound bias as price stabilizes within volatility band
Over the next several sessions, GSK is expected to remain within the GBX1,880–GBX1,937 volatility band. The base case scenario is for prices to stabilize within this sideways corridor. A bullish outcome could unfold if resistance is breached to the upside, while a bearish scenario would develop if price falls below immediate support.
Earlier, analysts noted that GSK's technical outlook remained mixed, as persistent selling pressure and overbought conditions posed challenges despite positive pipeline developments. The latest session's conflicting momentum signals and stabilization within the current volatility band introduce a nuanced scenario, with traders advised to monitor GBX1,889 as a critical support level for potential directional cues.






Latest GSK News



-
 Afghanistan
-
 Albania
-
 Algeria
-
 Angola
-
 Argentina
-
 Armenia
-
 Australia
-
 Austria
-
 Azerbaijan
-
 Bahamas
-
 Bahrain
-
 Bangladesh
-
 Belarus
-
 Belgium
-
 Bolivia
-
 Botswana
-
 Brazil
-
 Brunei
-
 Bulgaria
-
 Cambodia
-
 Cameroon
-
 Canada
-
 Chile
-
 China
-
 Colombia
-
 Congo
-
 Costa Rica
-
 Cote d'Ivoire
-
 Croatia
-
 Cuba
-
 Cyprus
-
 Czechia
-
 DR Congo
-
 Denmark
-
 Dominican Republic
-
 Ecuador
-
 Egypt
-
 El Salvador
-
 Estonia
-
 Eswatini
-
 Ethiopia
-
 Finland
-
 France
-
 Georgia
-
 Germany
-
 Ghana
-
 Greece
-
 Haiti
-
 Hong Kong
-
 Hungary
-
 India
-
 Indonesia
-
 Iran, Islamic republic
-
 Iraq
-
 Ireland
-
 Israel
-
 Italy
-
 Jamaica
-
 Japan
-
 Jordan
-
 Kazakhstan
-
 Kenya
-
 Korea
-
 Kuwait
-
 Kyrgyzstan
-
 Laos
-
 Latvia
-
 Lebanon
-
 Lesotho
-
 Libya
-
 Lithuania
-
 Luxembourg
-
 Madagascar
-
 Malaysia
-
 Malta
-
 Mauritius
-
 Mexico
-
 Moldova
-
 Mongolia
-
 Montenegro
-
 Morocco
-
 Mozambique
-
 Myanmar
-
 Namibia
-
 Nepal
-
 Netherlands
-
 New Zealand
-
 Nigeria
-
 North Macedonia
-
 Norway
-
 Oman
-
 Pakistan
-
 Palestine
-
 Panama
-
 Papua New Guinea
-
 Paraguay
-
 Peru
-
 Philippines
-
 Poland
-
 Portugal
-
 Puerto Rico
-
 Qatar
-
 Reunion
-
 Romania
-
 Rwanda
-
 Saudi Arabia
-
 Serbia
-
 Singapore
-
 Slovakia
-
 Slovenia
-
 Somalia
-
 South Africa
-
 Spain
-
 Sri Lanka
-
 Sweden
-
 Switzerland
-
 Syria
-
 Taiwan
-
 Tajikistan
-
 Tanzania
-
 Thailand
-
 Trinidad and Tobago
-
 Tunisia
-
 Turkey
-
 UAE
-
 Uganda
-
 Ukraine
-
 United Kingdom
-
United States
-
 Uruguay
-
 Uzbekistan
-
 Venezuela
-
 Vietnam
-
 Yemen
-
 Zambia
-
 Zimbabwe
- Forex
- Crypto












