

Vodafone stock holds steady amid seller pressure

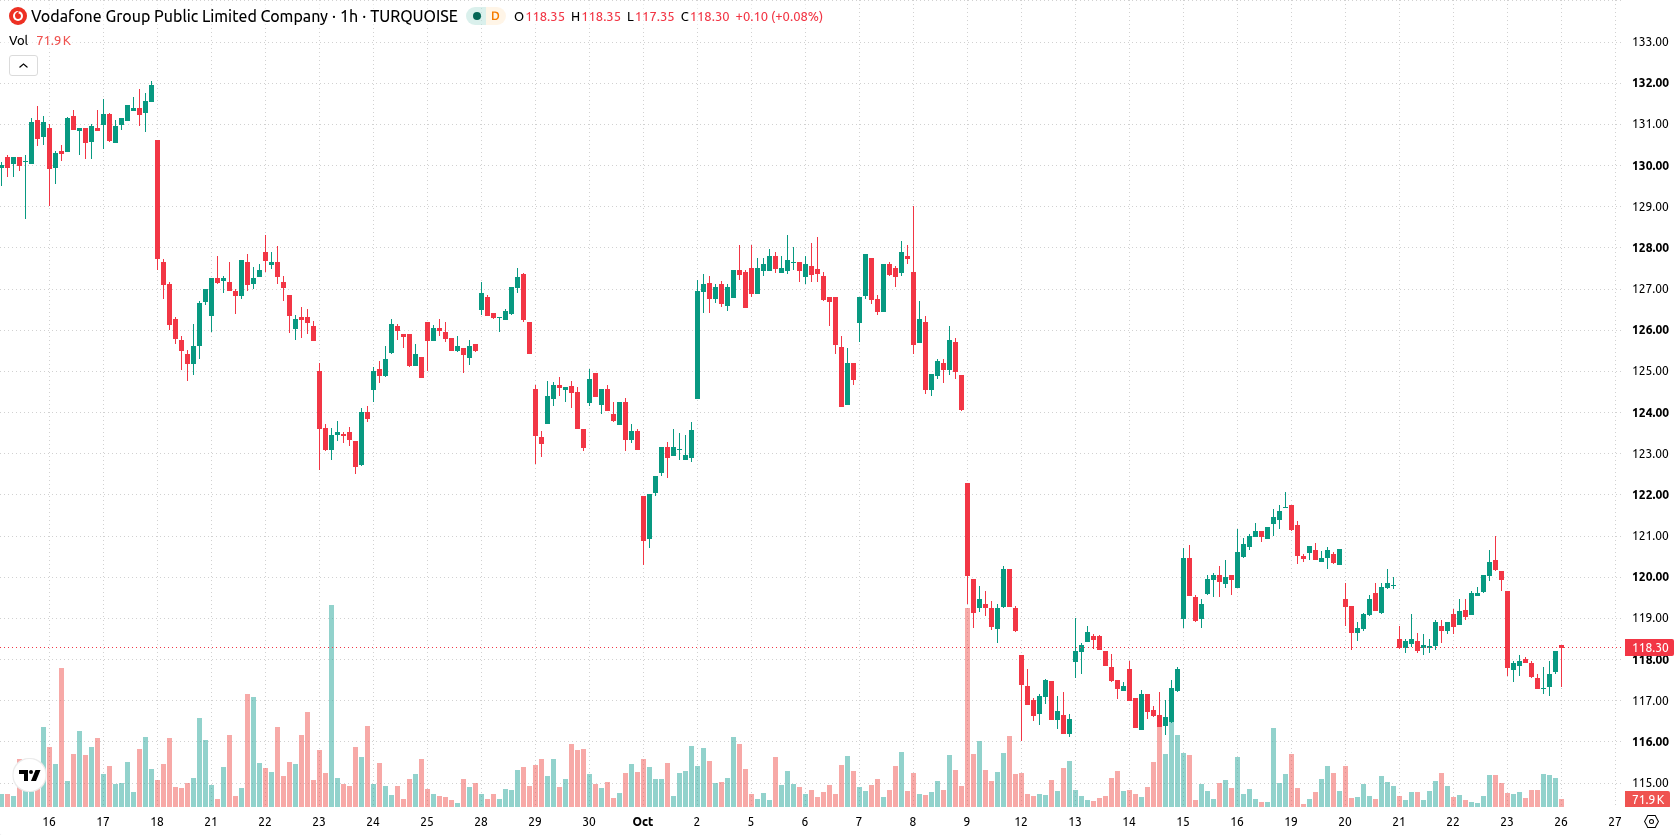
Vodafone (VOD) stock is trading at GBX118.35 after a modest intraday gain, finishing the session near its high. The price remains below both its short- and medium-term moving averages, though it stays above the long-term trend line.
 119.20
119.60
Highlights
- Vodafone stock yields 3.37%, with a payout ratio of 101.71% that exceeds current earnings capacity.
- The company may reassess its dividend distribution if earnings do not recover soon due to payout sustainability concerns.
- Shares trade below key short- and medium-term averages, with technical indicators broadly bearish and a 65% probability of near-term downside within a 116.61 to 120.09 GBX range.
Payout sustainability in question as dividend exceeds earnings
Vodafone Group PLC’s latest dividend yield stands at 3.37%, while its payout ratio has reached 101.71%, meaning the company is currently returning more to shareholders than its earnings support, according to Directorstalkinterviews. This dynamic introduces questions over the sustainability of current dividend levels, increasing investor focus on future earnings capacity and payout policy. The elevated payout signals a value transfer to shareholders but may prompt reassessment of the distribution if earnings do not recover in the near term.
Bearish momentum dominates amid oversold technical signals
On the H1 chart, VOD is trading below both the MA-20 at GBX118.71 and the MA-50 at GBX119.39, while staying above the MA-200 at GBX114.44. The immediate resistance is defined by the Ichimoku Kijun at GBX119.07. Momentum indicators—MACD and ADX—confirm a bearish bias, while RSI, CCI, and Bull/Bear Power all indicate oversold or weak conditions, highlighting ongoing selling pressure. Oscillator readings suggest sellers are currently dominant, with the Stochastic RSI neutral and the Awesome Oscillator in alignment with the downward momentum.
Consolidation outlook prevails as downside risk outweighs rebound odds
Looking ahead to the next two or three sessions, price is expected to consolidate between GBX116.61 and GBX120.09, a typical volatility band relative to current levels. There is a 65% probability of a move down within this range, with only a 35% chance for a short-term rebound. To shift the scenario bullishly, the price would need to clear the resistance near GBX119.07, while a break below GBX116.61 would reinforce further declines.
Earlier, analysts noted that Vodafone shares faced persistent bearish momentum and lacked major catalysts for a substantive reversal. The current analysis both reinforces this cautious outlook and introduces concerns over dividend sustainability, highlighting the need to monitor the stock’s ability to hold above its long-term support as payout pressures intensify.






Latest Vodafone News



-
 Afghanistan
-
 Albania
-
 Algeria
-
 Angola
-
 Argentina
-
 Armenia
-
 Australia
-
 Austria
-
 Azerbaijan
-
 Bahamas
-
 Bahrain
-
 Bangladesh
-
 Belarus
-
 Belgium
-
 Bolivia
-
 Botswana
-
 Brazil
-
 Brunei
-
 Bulgaria
-
 Cambodia
-
 Cameroon
-
 Canada
-
 Chile
-
 China
-
 Colombia
-
 Congo
-
 Costa Rica
-
 Cote d'Ivoire
-
 Croatia
-
 Cuba
-
 Cyprus
-
 Czechia
-
 DR Congo
-
 Denmark
-
 Dominican Republic
-
 Ecuador
-
 Egypt
-
 El Salvador
-
 Estonia
-
 Eswatini
-
 Ethiopia
-
 Finland
-
 France
-
 Georgia
-
 Germany
-
 Ghana
-
 Greece
-
 Haiti
-
 Hong Kong
-
 Hungary
-
 India
-
 Indonesia
-
 Iran, Islamic republic
-
 Iraq
-
 Ireland
-
 Israel
-
 Italy
-
 Jamaica
-
 Japan
-
 Jordan
-
 Kazakhstan
-
 Kenya
-
 Korea
-
 Kuwait
-
 Kyrgyzstan
-
 Laos
-
 Latvia
-
 Lebanon
-
 Lesotho
-
 Libya
-
 Lithuania
-
 Luxembourg
-
 Madagascar
-
 Malaysia
-
 Malta
-
 Mauritius
-
 Mexico
-
 Moldova
-
 Mongolia
-
 Montenegro
-
 Morocco
-
 Mozambique
-
 Myanmar
-
 Namibia
-
 Nepal
-
 Netherlands
-
 New Zealand
-
 Nigeria
-
 North Macedonia
-
 Norway
-
 Oman
-
 Pakistan
-
 Palestine
-
 Panama
-
 Papua New Guinea
-
 Paraguay
-
 Peru
-
 Philippines
-
 Poland
-
 Portugal
-
 Puerto Rico
-
 Qatar
-
 Reunion
-
 Romania
-
 Rwanda
-
 Saudi Arabia
-
 Serbia
-
 Singapore
-
 Slovakia
-
 Slovenia
-
 Somalia
-
 South Africa
-
 Spain
-
 Sri Lanka
-
 Sweden
-
 Switzerland
-
 Syria
-
 Taiwan
-
 Tajikistan
-
 Tanzania
-
 Thailand
-
 Trinidad and Tobago
-
 Tunisia
-
 Turkey
-
 UAE
-
 Uganda
-
 Ukraine
-
 United Kingdom
-
United States
-
 Uruguay
-
 Uzbekistan
-
 Venezuela
-
 Vietnam
-
 Yemen
-
 Zambia
-
 Zimbabwe
- Forex
- Crypto












