

ENB trades sideways as consolidation holds above key support

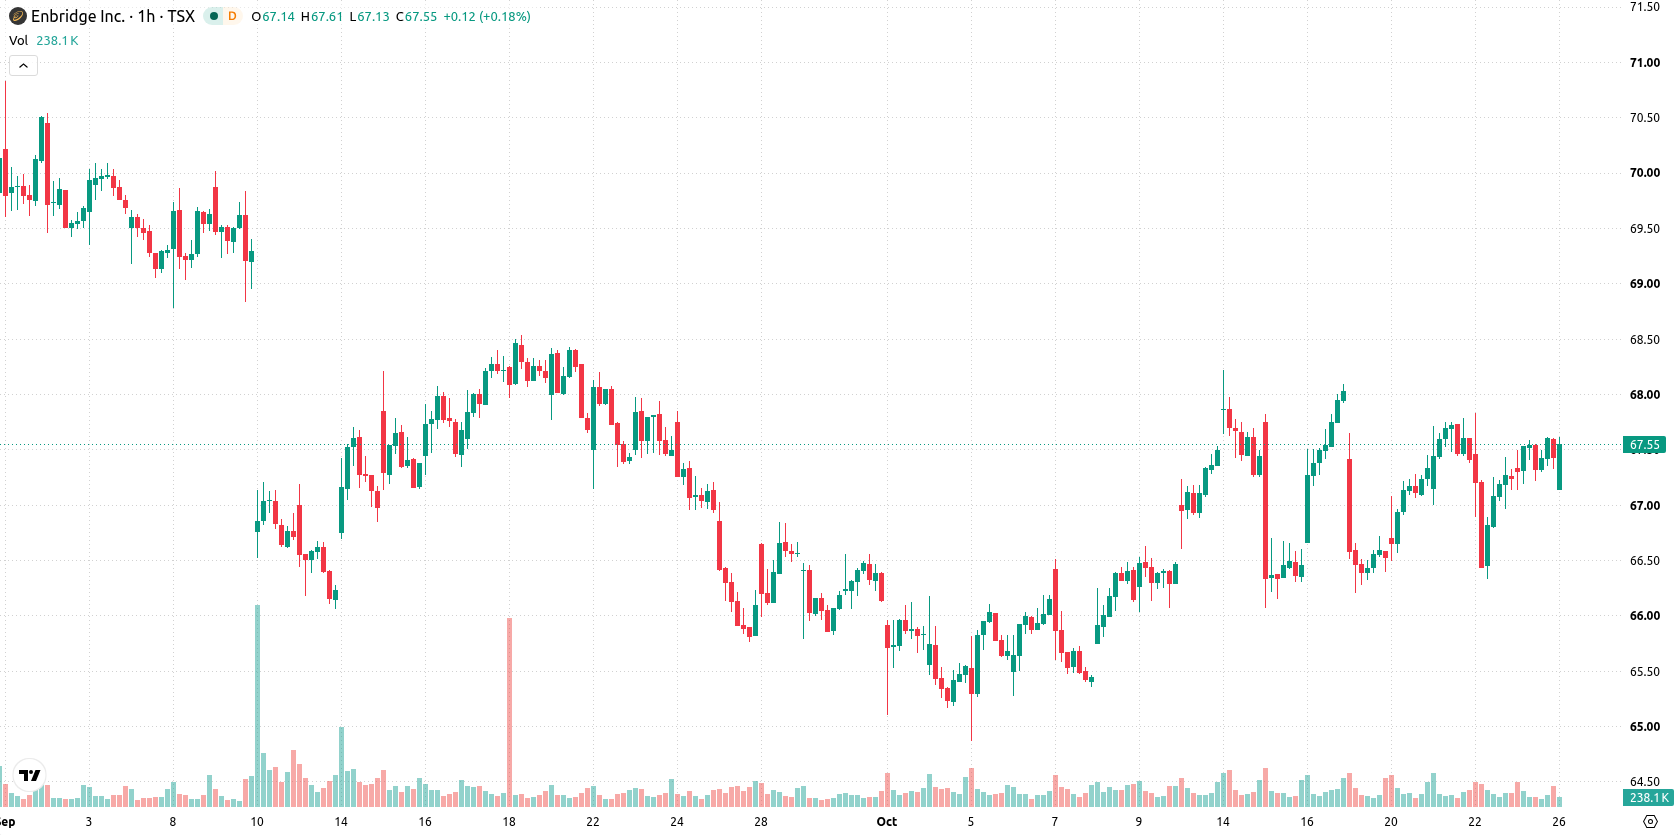
Enbridge (ENB) stock is trading at C$67.5 after a marginal gain in today's session. The price remains above its key moving averages, reflecting short-term momentum.
 69.27
69.27
Highlights
- Enbridge stock is displaying short- and medium-term bullish momentum but remains under a bearish long-term trend.
- Momentum indicators are mixed, with MACD showing a buy signal and ADX and oscillator readings indicating weak trend strength.
- Over the coming days, Enbridge stock is expected to consolidate between C$66.86 to C$68.14, with a high probability of upward movement.
Mixed momentum as resistance caps bullish signals
On the technical side, ENB finds immediate support at the Ichimoku Kijun level of C$67.08. The MA-20 and MA-50 on the hourly chart stand at C$67.33 and C$67.1, respectively, while resistance is defined by the MA-200 on the daily chart at C$72.42. MACD currently signals a Buy, though ADX reads Neutral, implying muted trend strength. RSI stands at 53.91, which indicates mild buying, while CCI remains Neutral and Stoch RSI enters Overbought territory, suggesting some intraday overextension. Bull/Bear Power reflects prominent buyer dominance, whereas the Awesome Oscillator is Neutral, providing limited support to the prevailing momentum.
Upside bias as volatility band contains downside risk
Over the coming sessions, ENB is expected to consolidate within a typical volatility band of C$66.86 to C$68.14. The probability of further upward movement is considered very high, with limited risk of a short-term decline. A break above C$68.14 could lead to additional upside, while a drop below C$66.86 would likely open the door to near-term downside.
Earlier, analysts noted that Enbridge shares were displaying modest bullish momentum but remained rangebound, with consolidation signaling a potential breakout or downside risk. The latest technical signals continue to indicate near-term consolidation, but a break above or below the C$66.86–C$68.14 band should be monitored as it may define the next significant price move.










-
 Afghanistan
-
 Albania
-
 Algeria
-
 Angola
-
 Argentina
-
 Armenia
-
 Australia
-
 Austria
-
 Azerbaijan
-
 Bahamas
-
 Bahrain
-
 Bangladesh
-
 Belarus
-
 Belgium
-
 Bolivia
-
 Botswana
-
 Brazil
-
 Brunei
-
 Bulgaria
-
 Cambodia
-
 Cameroon
-
 Canada
-
 Chile
-
 China
-
 Colombia
-
 Congo
-
 Costa Rica
-
 Cote d'Ivoire
-
 Croatia
-
 Cuba
-
 Cyprus
-
 Czechia
-
 DR Congo
-
 Denmark
-
 Dominican Republic
-
 Ecuador
-
 Egypt
-
 El Salvador
-
 Estonia
-
 Eswatini
-
 Ethiopia
-
 Finland
-
 France
-
 Georgia
-
 Germany
-
 Ghana
-
 Greece
-
 Haiti
-
 Hong Kong
-
 Hungary
-
 India
-
 Indonesia
-
 Iran, Islamic republic
-
 Iraq
-
 Ireland
-
 Israel
-
 Italy
-
 Jamaica
-
 Japan
-
 Jordan
-
 Kazakhstan
-
 Kenya
-
 Korea
-
 Kuwait
-
 Kyrgyzstan
-
 Laos
-
 Latvia
-
 Lebanon
-
 Lesotho
-
 Libya
-
 Lithuania
-
 Luxembourg
-
 Madagascar
-
 Malaysia
-
 Malta
-
 Mauritius
-
 Mexico
-
 Moldova
-
 Mongolia
-
 Montenegro
-
 Morocco
-
 Mozambique
-
 Myanmar
-
 Namibia
-
 Nepal
-
 Netherlands
-
 New Zealand
-
 Nigeria
-
 North Macedonia
-
 Norway
-
 Oman
-
 Pakistan
-
 Palestine
-
 Panama
-
 Papua New Guinea
-
 Paraguay
-
 Peru
-
 Philippines
-
 Poland
-
 Portugal
-
 Puerto Rico
-
 Qatar
-
 Reunion
-
 Romania
-
 Rwanda
-
 Saudi Arabia
-
 Serbia
-
 Singapore
-
 Slovakia
-
 Slovenia
-
 Somalia
-
 South Africa
-
 Spain
-
 Sri Lanka
-
 Sweden
-
 Switzerland
-
 Syria
-
 Taiwan
-
 Tajikistan
-
 Tanzania
-
 Thailand
-
 Trinidad and Tobago
-
 Tunisia
-
 Turkey
-
 UAE
-
 Uganda
-
 Ukraine
-
 United Kingdom
-
United States
-
 Uruguay
-
 Uzbekistan
-
 Venezuela
-
 Vietnam
-
 Yemen
-
 Zambia
-
 Zimbabwe
- Forex
- Crypto












