

Johnson & Johnson announces quarterly dividend and earnings guidance: Can JNJ continue gains?

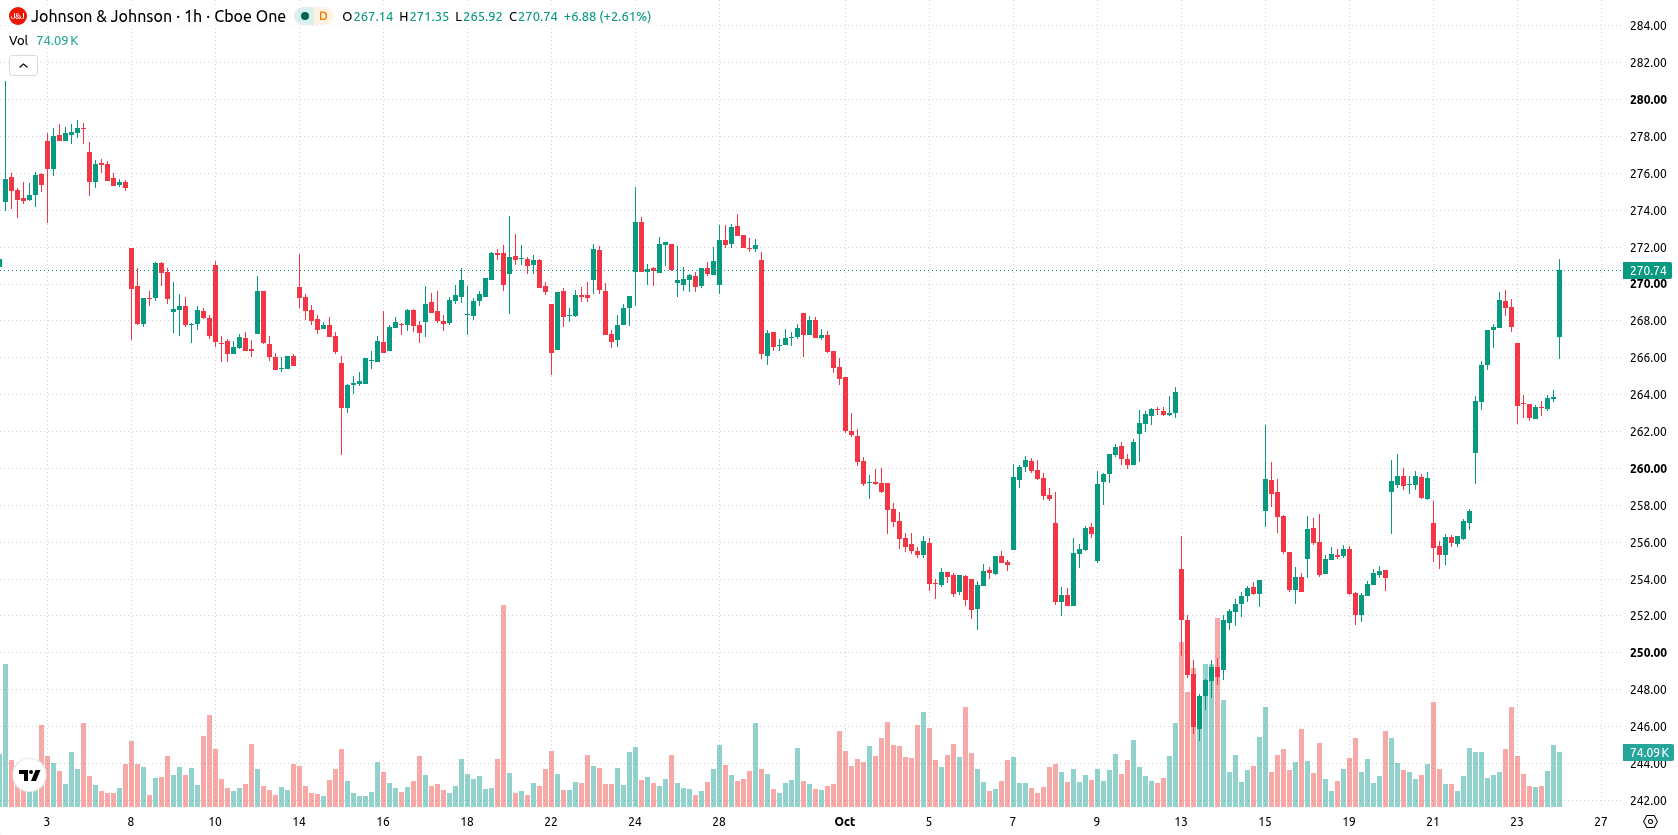
Johnson & Johnson (JNJ) stock is trading at $272.05 after a 3.1% gain on the day. The price sits above its key moving averages, reflecting a firm position in both short- and long-term trends.
 282.02
Highlights
- Johnson & Johnson announced a quarterly dividend to be paid on December 8, delivering direct returns to shareholders.
- The company projects 2026 full year earnings per share in the $11.05 to $11.15 range, reducing medium-term uncertainty.
- Shares surged to $272.05, with technical indicators showing robust upward momentum and an expected trading range of $263.61 to $278.77 in the next 2 to 3 days.
Dividend payout and earnings guidance fuel investor demand
Johnson & Johnson has announced a quarterly dividend, set to be paid on December 8, providing direct cash returns to shareholders and offering a compelling income proposition that can stimulate near-term demand for the stock. The company’s recent disclosure of fiscal year 2026 earnings guidance between $11.05 and $11.15 EPS further clarifies management’s medium-term profit outlook, lowering uncertainty and supporting ongoing investor interest. Together, these updates emphasize the company’s commitment to shareholder returns and operational transparency, reinforcing the case for the present upward momentum.
Bullish momentum intact amid mixed indicator signals
Technically, JNJ trades above the MA-20 and MA-50 on the hourly chart and remains firmly above the MA-200 on the daily timeframe, maintaining a well-defined bullish structure. Immediate support is identified at the Ichimoku Kijun line at $262.1, while price recently surged to $272.05, creating a session gap of 6.93. Key indicators present a mixed picture: MACD signals Strong Buy, ADX indicates Buy, and RSI at 57.1 reflects a positive tilt. Stochastic RSI is oversold, suggesting potential for a short-term rebound, while CCI is neutral and the Awesome Oscillator is also neutral. Bull/Bear Power indicates strong buyer dominance but is in overbought territory, highlighting robust momentum but also possible near-term divergence.
Limited downside risk as upside breakout gains probability
In the next two to three trading days, JNJ is expected to fluctuate within a range of $263.61 to $278.77. Probabilities strongly favor an upward move, with limited likelihood of a meaningful decline. The baseline scenario is for sideways price movement within this volatility band, with bullish continuation possible on resistance breakouts and a bearish shift if price breaks below immediate support.
Previously it was reported that Johnson & Johnson expanded its prostate cancer pipeline with the addition of JNJ-6143, demonstrating early-stage efficacy in advanced disease. With JNJ shares currently trading above key moving averages and exhibiting robust technical momentum, traders should monitor for potential resistance breaks above $278.77 to confirm further upside in the near term.






Latest Johnson & Johnson News





-
 Afghanistan
-
 Albania
-
 Algeria
-
 Angola
-
 Argentina
-
 Armenia
-
 Australia
-
 Austria
-
 Azerbaijan
-
 Bahamas
-
 Bahrain
-
 Bangladesh
-
 Belarus
-
 Belgium
-
 Bolivia
-
 Botswana
-
 Brazil
-
 Brunei
-
 Bulgaria
-
 Cambodia
-
 Cameroon
-
 Canada
-
 Chile
-
 China
-
 Colombia
-
 Congo
-
 Costa Rica
-
 Cote d'Ivoire
-
 Croatia
-
 Cuba
-
 Cyprus
-
 Czechia
-
 DR Congo
-
 Denmark
-
 Dominican Republic
-
 Ecuador
-
 Egypt
-
 El Salvador
-
 Estonia
-
 Eswatini
-
 Ethiopia
-
 Finland
-
 France
-
 Georgia
-
 Germany
-
 Ghana
-
 Greece
-
 Haiti
-
 Hong Kong
-
 Hungary
-
 India
-
 Indonesia
-
 Iran, Islamic republic
-
 Iraq
-
 Ireland
-
 Israel
-
 Italy
-
 Jamaica
-
 Japan
-
 Jordan
-
 Kazakhstan
-
 Kenya
-
 Korea
-
 Kuwait
-
 Kyrgyzstan
-
 Laos
-
 Latvia
-
 Lebanon
-
 Lesotho
-
 Libya
-
 Lithuania
-
 Luxembourg
-
 Madagascar
-
 Malaysia
-
 Malta
-
 Mauritius
-
 Mexico
-
 Moldova
-
 Mongolia
-
 Montenegro
-
 Morocco
-
 Mozambique
-
 Myanmar
-
 Namibia
-
 Nepal
-
 Netherlands
-
 New Zealand
-
 Nigeria
-
 North Macedonia
-
 Norway
-
 Oman
-
 Pakistan
-
 Palestine
-
 Panama
-
 Papua New Guinea
-
 Paraguay
-
 Peru
-
 Philippines
-
 Poland
-
 Portugal
-
 Puerto Rico
-
 Qatar
-
 Reunion
-
 Romania
-
 Rwanda
-
 Saudi Arabia
-
 Serbia
-
 Singapore
-
 Slovakia
-
 Slovenia
-
 Somalia
-
 South Africa
-
 Spain
-
 Sri Lanka
-
 Sweden
-
 Switzerland
-
 Syria
-
 Taiwan
-
 Tajikistan
-
 Tanzania
-
 Thailand
-
 Trinidad and Tobago
-
 Tunisia
-
 Turkey
-
 UAE
-
 Uganda
-
 Ukraine
-
 United Kingdom
-
United States
-
 Uruguay
-
 Uzbekistan
-
 Venezuela
-
 Vietnam
-
 Yemen
-
 Zambia
-
 Zimbabwe
- Forex
- Crypto












