

Cisco shares rangebound as oversold Stoch RSI draws focus for potential reversal: weekly analysis

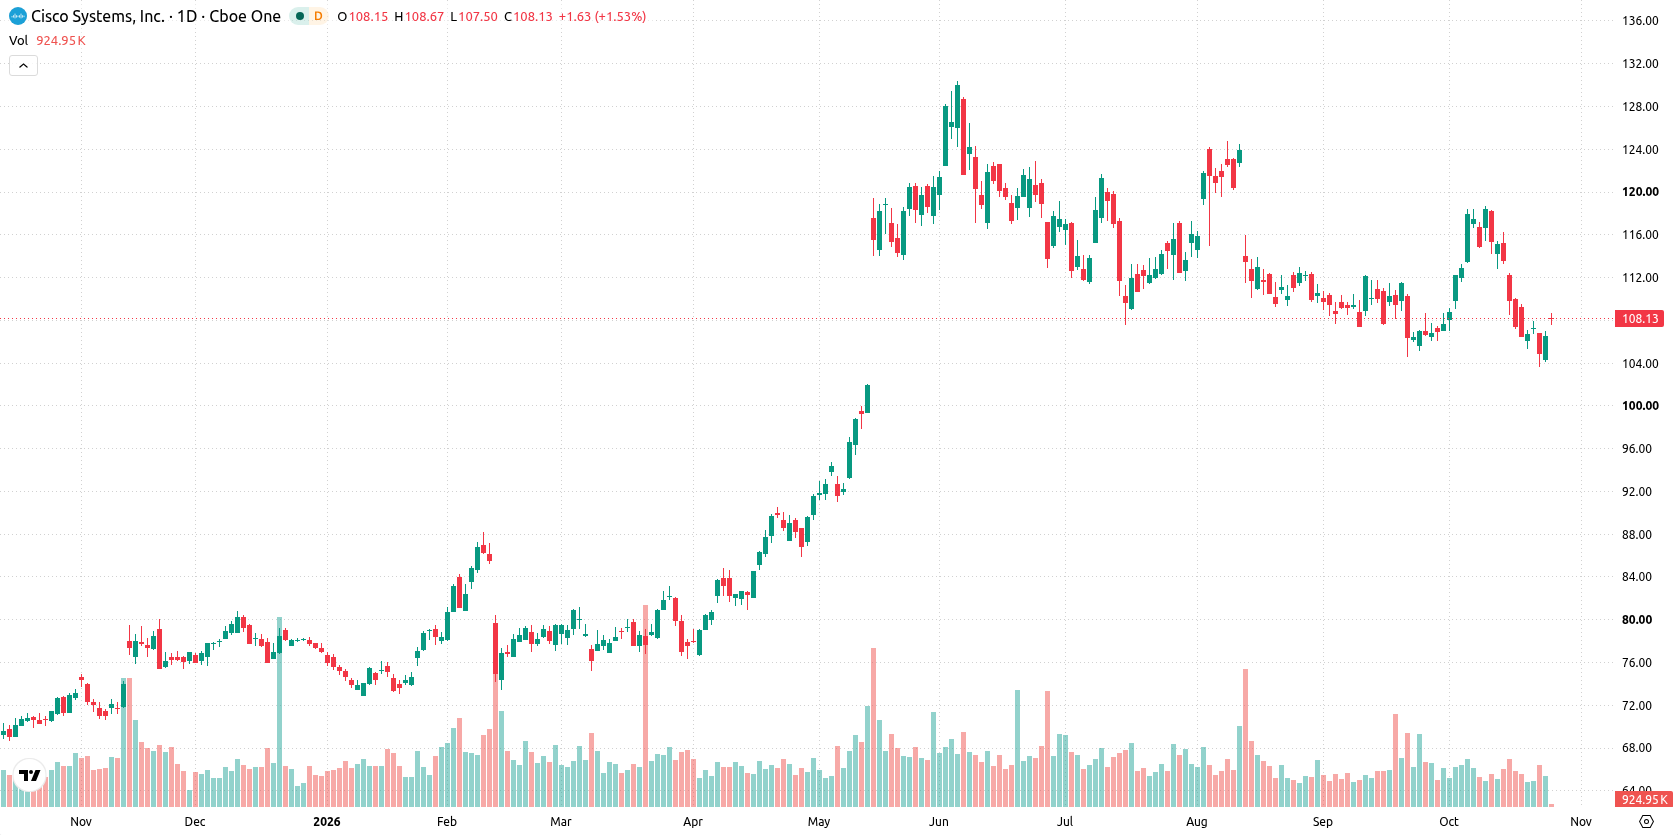
Shares of Cisco Systems, Inc. (CSCO) are trading near $109 after gaining around 2.4% over the past week, as sellers continued to pressure the setup deep into oversold territory. The chart shows mixed momentum with daily signals conflicted, suggesting traders will be watching closely to see if this push lower exhausts or develops into a renewed trend in the coming week.
 105.41
112.68
Highlights
- Shares of Cisco rose $2.5 over the past week to $108.99, trading just below short-term averages but well above the 200-day level.
- The long-term trend remains bullish, with mixed daily momentum signals and price near the top of its weekly range.
- Cisco stock is expected to consolidate between $107.15 and $110.82 over the next five days, with resistance at $110.22 and support at $107.74.
Record revenue and AI-driven cuts drive sentiment around restructuring costs
Cisco reported a record $15.8 billion in quarterly revenue and announced plans to cut nearly 4,000 jobs to support artificial intelligence investments, according to Startup Fortune. The restructuring comes with estimated charges up to $1 billion, with about $450 million expected to be booked next quarter (source: Startup Fortune). Additional headlines this week spotlighted Cisco's launch of new high-density AI networking hardware and ongoing legal objections to tokenized versions of its stock on blockchain platforms (sources: Yahoo Finance, Cryptonews.net).
Mixed momentum signals emerge as price nears weekly resistance zones
On the daily chart, the setup features a developing trend with the price near the top of its weekly range and volatility at 3.97%. Momentum is mixed: MACD and ADX both point to sell, while Stoch RSI sits oversold at 13.94. Immediate resistance is defined by the 50-day average at $110.22, with further resistance from the Ichimoku Kijun at $111.14, while support rests at $107.74. This mix of signals points to an emerging move higher that is not yet confirmed.
Consolidation favored next week as breakout risk centers on $110.22
Over the next five trading days, Cisco is expected to trade between $107.15 and $110.82, with a 67% probability of a decrease and a 33% probability of an increase. The base case is a consolidation within this range capped by resistance at $110.22. A sustained push above $110.22 would open a bullish scenario toward the top of the expected range, while a drop below $107.74 would shift the bias firmly bearish.
Earlier, analysts noted that Cisco shares were in a consolidation phase with no clear trend direction as mixed signals dominated technical evaluations. The current setup adds new dimensions with increased volatility and evolving fundamentals, making $110.22 a key resistance level to watch for potential breakout or reversal in the week ahead.






Latest Cisco News




-
 Afghanistan
-
 Albania
-
 Algeria
-
 Angola
-
 Argentina
-
 Armenia
-
 Australia
-
 Austria
-
 Azerbaijan
-
 Bahamas
-
 Bahrain
-
 Bangladesh
-
 Belarus
-
 Belgium
-
 Bolivia
-
 Botswana
-
 Brazil
-
 Brunei
-
 Bulgaria
-
 Cambodia
-
 Cameroon
-
 Canada
-
 Chile
-
 China
-
 Colombia
-
 Congo
-
 Costa Rica
-
 Cote d'Ivoire
-
 Croatia
-
 Cuba
-
 Cyprus
-
 Czechia
-
 DR Congo
-
 Denmark
-
 Dominican Republic
-
 Ecuador
-
 Egypt
-
 El Salvador
-
 Estonia
-
 Eswatini
-
 Ethiopia
-
 Finland
-
 France
-
 Georgia
-
 Germany
-
 Ghana
-
 Greece
-
 Haiti
-
 Hong Kong
-
 Hungary
-
 India
-
 Indonesia
-
 Iran, Islamic republic
-
 Iraq
-
 Ireland
-
 Israel
-
 Italy
-
 Jamaica
-
 Japan
-
 Jordan
-
 Kazakhstan
-
 Kenya
-
 Korea
-
 Kuwait
-
 Kyrgyzstan
-
 Laos
-
 Latvia
-
 Lebanon
-
 Lesotho
-
 Libya
-
 Lithuania
-
 Luxembourg
-
 Madagascar
-
 Malaysia
-
 Malta
-
 Mauritius
-
 Mexico
-
 Moldova
-
 Mongolia
-
 Montenegro
-
 Morocco
-
 Mozambique
-
 Myanmar
-
 Namibia
-
 Nepal
-
 Netherlands
-
 New Zealand
-
 Nigeria
-
 North Macedonia
-
 Norway
-
 Oman
-
 Pakistan
-
 Palestine
-
 Panama
-
 Papua New Guinea
-
 Paraguay
-
 Peru
-
 Philippines
-
 Poland
-
 Portugal
-
 Puerto Rico
-
 Qatar
-
 Reunion
-
 Romania
-
 Rwanda
-
 Saudi Arabia
-
 Serbia
-
 Singapore
-
 Slovakia
-
 Slovenia
-
 Somalia
-
 South Africa
-
 Spain
-
 Sri Lanka
-
 Sweden
-
 Switzerland
-
 Syria
-
 Taiwan
-
 Tajikistan
-
 Tanzania
-
 Thailand
-
 Trinidad and Tobago
-
 Tunisia
-
 Turkey
-
 UAE
-
 Uganda
-
 Ukraine
-
 United Kingdom
-
United States
-
 Uruguay
-
 Uzbekistan
-
 Venezuela
-
 Vietnam
-
 Yemen
-
 Zambia
-
 Zimbabwe
- Forex
- Crypto












