

TLRY slides as seller pressure weighs on short-term trend

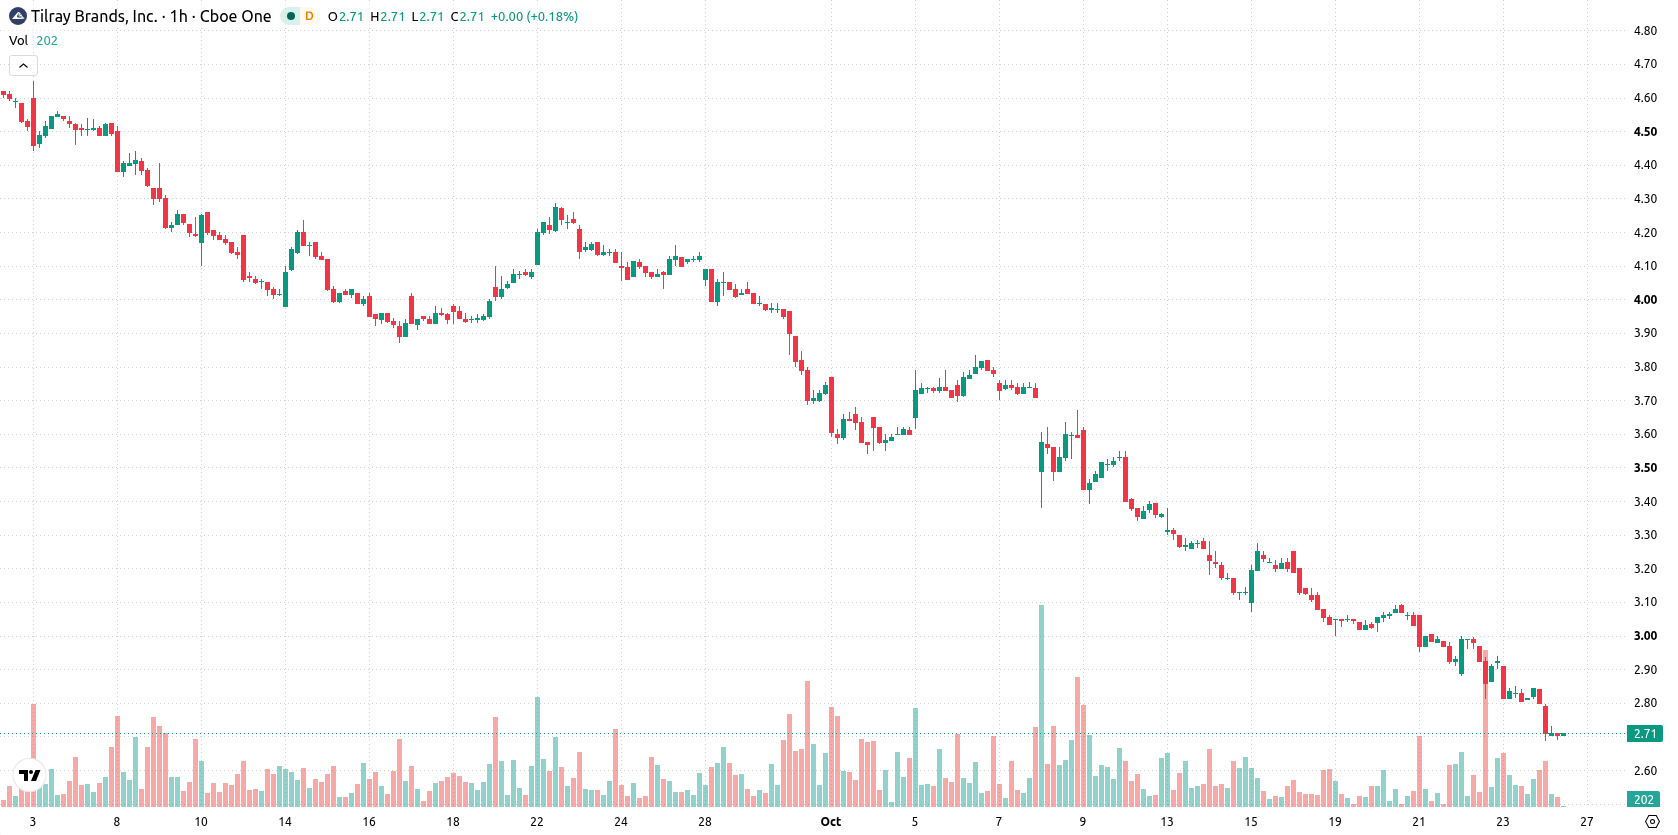
Tilray (TLRY) stock is trading at $2.71 after a daily drop of 3.39%. The current price remains below its key moving averages, reflecting ongoing downward momentum in the short, medium, and longer timeframes.
 2.67
2.80
Highlights
- TLRY stock trades well below key moving averages on hourly and daily charts, indicating persistent downward pressure.
- Momentum and oscillator signals are unanimously bearish and confirm strong downside momentum and oversold conditions.
- For the next two to three sessions, the price range is expected to be $2.58 to $2.84 with a high probability of further declines.
Bearish momentum confirmed as indicators flag oversold territory
On the technical side, TLRY/USD trades below the MA-20 at $2.91 and MA-50 at $3.02 on the H1 timeframe, and remains well under the MA-200 at $5.64 on the daily chart. Immediate resistance is highlighted by the Ichimoku Kijun at $2.95. MACD and ADX are both on clear sell signals, confirming strong downside momentum. Lower readings from RSI at 34.02, as well as weak Stochastic RSI and CCI, signal oversold conditions, and Bull/Bear Power further indicates intra-period seller dominance. The Awesome Oscillator is neutral, offering no additional trend confirmation. TLRY is currently near its session low of $2.71, reinforcing the negative momentum signaled by aligned bearish momentum and oscillator readings.
Downside risk prevails as breakout remains unlikely
Looking ahead to the next two to three sessions, TLRY is expected to trade within a range of $2.58 to $2.84, which corresponds to the volatility band relative to current levels. The probability of an upward breakout is very low, while the likelihood of further decline is considerably higher. A bullish reversal scenario would require a decisive move above $2.95. Conversely, a bearish extension could occur if price falls below $2.58, reinforcing the downtrend.
Earlier, analysts noted that Tilray continued to face persistent downside risk due to ongoing technical weakness. This latest analysis reaffirms that bearish outlook, with a key near-term risk focused on a possible extension of declines if the stock breaks below $2.58 in the coming sessions.






Latest Tilray Brands News




-
 Afghanistan
-
 Albania
-
 Algeria
-
 Angola
-
 Argentina
-
 Armenia
-
 Australia
-
 Austria
-
 Azerbaijan
-
 Bahamas
-
 Bahrain
-
 Bangladesh
-
 Belarus
-
 Belgium
-
 Bolivia
-
 Botswana
-
 Brazil
-
 Brunei
-
 Bulgaria
-
 Cambodia
-
 Cameroon
-
 Canada
-
 Chile
-
 China
-
 Colombia
-
 Congo
-
 Costa Rica
-
 Cote d'Ivoire
-
 Croatia
-
 Cuba
-
 Cyprus
-
 Czechia
-
 DR Congo
-
 Denmark
-
 Dominican Republic
-
 Ecuador
-
 Egypt
-
 El Salvador
-
 Estonia
-
 Eswatini
-
 Ethiopia
-
 Finland
-
 France
-
 Georgia
-
 Germany
-
 Ghana
-
 Greece
-
 Haiti
-
 Hong Kong
-
 Hungary
-
 India
-
 Indonesia
-
 Iran, Islamic republic
-
 Iraq
-
 Ireland
-
 Israel
-
 Italy
-
 Jamaica
-
 Japan
-
 Jordan
-
 Kazakhstan
-
 Kenya
-
 Korea
-
 Kuwait
-
 Kyrgyzstan
-
 Laos
-
 Latvia
-
 Lebanon
-
 Lesotho
-
 Libya
-
 Lithuania
-
 Luxembourg
-
 Madagascar
-
 Malaysia
-
 Malta
-
 Mauritius
-
 Mexico
-
 Moldova
-
 Mongolia
-
 Montenegro
-
 Morocco
-
 Mozambique
-
 Myanmar
-
 Namibia
-
 Nepal
-
 Netherlands
-
 New Zealand
-
 Nigeria
-
 North Macedonia
-
 Norway
-
 Oman
-
 Pakistan
-
 Palestine
-
 Panama
-
 Papua New Guinea
-
 Paraguay
-
 Peru
-
 Philippines
-
 Poland
-
 Portugal
-
 Puerto Rico
-
 Qatar
-
 Reunion
-
 Romania
-
 Rwanda
-
 Saudi Arabia
-
 Serbia
-
 Singapore
-
 Slovakia
-
 Slovenia
-
 Somalia
-
 South Africa
-
 Spain
-
 Sri Lanka
-
 Sweden
-
 Switzerland
-
 Syria
-
 Taiwan
-
 Tajikistan
-
 Tanzania
-
 Thailand
-
 Trinidad and Tobago
-
 Tunisia
-
 Turkey
-
 UAE
-
 Uganda
-
 Ukraine
-
 United Kingdom
-
United States
-
 Uruguay
-
 Uzbekistan
-
 Venezuela
-
 Vietnam
-
 Yemen
-
 Zambia
-
 Zimbabwe
- Forex
- Crypto












