

What's behind Suncor Energy's latest 2.2% stock pullback?

Suncor Energy Inc. (SU) fell 2.18% after the company completed the sale of certain offshore interests for CAD 1.20 billion upfront, with further contingent payments possible. The down move is broadly supported by technical signals as the stock trades above key moving averages but shows short-term overheating and price pressure following the open.
 111.14
112.03
Highlights
- Suncor Energy completed a sale of certain offshore interests for CAD 1.20 billion upfront and may receive up to CAD 350 million more.
- The company reported CAD 17.50 billion in revenue for the second quarter of 2026, with retention of Hebron and Hibernia project interests.
- Suncor Energy stock trades in a bullish structure, with a projected five-day range of C$106.5 to C$112.68 and technicals indicating overbought conditions.
Asset divestment and project retention sustain revenue despite selling pressure
Suncor Energy completed the sale of certain offshore interests for CAD 1.20 billion upfront, with the possibility of receiving up to CAD 350 million in additional payments. The buyer assumed related investment commitments and liabilities, and Suncor retained its interests in the Hebron and Hibernia projects. The company also reported CAD 17.50 billion in revenue for the second quarter of 2026, though price action has remained under broader selling pressure.
Momentum signals align with overbought risks as volatility rises
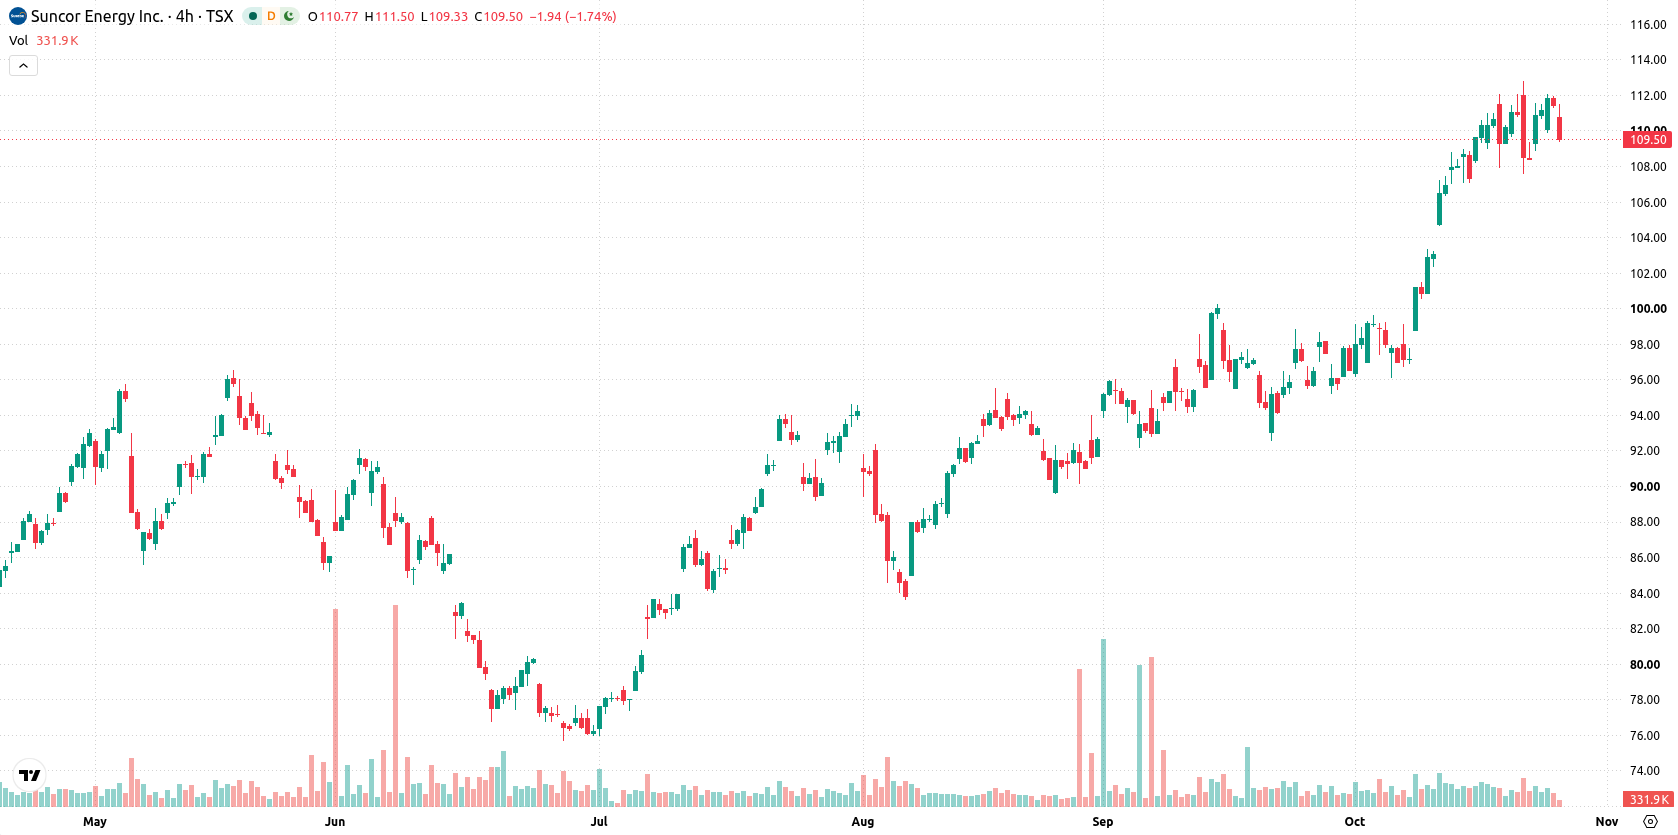
Suncor Energy is trading above its 20-day (C$103.94), 50-day (C$98.22), and 200-day (C$87.05) moving averages, reflecting sustained bullish momentum across timeframes. The near-term ceiling is at C$110.49, with support at C$107.62, and a strong MA-50 versus MA-200 setup confirms a positive long-term structure. Momentum indicators including MACD and ADX signal buy conditions, but the RSI, Stochastic RSI, and CCI are all overbought, pointing to significant buying force and potential short-term overheating. Bull/Bear Power (BBP) favors buyers but also warns of an overbought environment, and the Awesome Oscillator is neutral. Current session action includes a 2.18% drop, a downside gap at the open, and trading near session lows as volatility stays elevated at 0.84%. Signals from momentum and price action align, suggesting underlying strength but also potential for near-term consolidation.
Earlier, analysts noted that Suncor Energy’s technical structure remained broadly bullish, with ongoing buy signals across key momentum indicators suggesting strength. The current analysis reinforces this outlook, with recent price pressure following the asset sale likely to result in near-term consolidation, making C$110.49 a critical resistance level to watch for a potential breakout.






Latest Suncor Energy News


-
 Afghanistan
-
 Albania
-
 Algeria
-
 Angola
-
 Argentina
-
 Armenia
-
 Australia
-
 Austria
-
 Azerbaijan
-
 Bahamas
-
 Bahrain
-
 Bangladesh
-
 Belarus
-
 Belgium
-
 Bolivia
-
 Botswana
-
 Brazil
-
 Brunei
-
 Bulgaria
-
 Cambodia
-
 Cameroon
-
 Canada
-
 Chile
-
 China
-
 Colombia
-
 Congo
-
 Costa Rica
-
 Cote d'Ivoire
-
 Croatia
-
 Cuba
-
 Cyprus
-
 Czechia
-
 DR Congo
-
 Denmark
-
 Dominican Republic
-
 Ecuador
-
 Egypt
-
 El Salvador
-
 Estonia
-
 Eswatini
-
 Ethiopia
-
 Finland
-
 France
-
 Georgia
-
 Germany
-
 Ghana
-
 Greece
-
 Haiti
-
 Hong Kong
-
 Hungary
-
 India
-
 Indonesia
-
 Iran, Islamic republic
-
 Iraq
-
 Ireland
-
 Israel
-
 Italy
-
 Jamaica
-
 Japan
-
 Jordan
-
 Kazakhstan
-
 Kenya
-
 Korea
-
 Kuwait
-
 Kyrgyzstan
-
 Laos
-
 Latvia
-
 Lebanon
-
 Lesotho
-
 Libya
-
 Lithuania
-
 Luxembourg
-
 Madagascar
-
 Malaysia
-
 Malta
-
 Mauritius
-
 Mexico
-
 Moldova
-
 Mongolia
-
 Montenegro
-
 Morocco
-
 Mozambique
-
 Myanmar
-
 Namibia
-
 Nepal
-
 Netherlands
-
 New Zealand
-
 Nigeria
-
 North Macedonia
-
 Norway
-
 Oman
-
 Pakistan
-
 Palestine
-
 Panama
-
 Papua New Guinea
-
 Paraguay
-
 Peru
-
 Philippines
-
 Poland
-
 Portugal
-
 Puerto Rico
-
 Qatar
-
 Reunion
-
 Romania
-
 Rwanda
-
 Saudi Arabia
-
 Serbia
-
 Singapore
-
 Slovakia
-
 Slovenia
-
 Somalia
-
 South Africa
-
 Spain
-
 Sri Lanka
-
 Sweden
-
 Switzerland
-
 Syria
-
 Taiwan
-
 Tajikistan
-
 Tanzania
-
 Thailand
-
 Trinidad and Tobago
-
 Tunisia
-
 Turkey
-
 UAE
-
 Uganda
-
 Ukraine
-
 United Kingdom
-
United States
-
 Uruguay
-
 Uzbekistan
-
 Venezuela
-
 Vietnam
-
 Yemen
-
 Zambia
-
 Zimbabwe
- Forex
- Crypto












