

Home Depot shares hold recent range amid conflicting momentum signals: weekly analysis

Shares of Home Depot, Inc (HD) are trading near $318 as the rally shows signs of fatigue, with the technical setup flashing conflicting momentum signals. Chart indicators suggest that short-term strength is now running up against overbought territory, raising the odds for volatile swings as the new week begins.
 349.34
356.88
Highlights
- Shares of Home Depot are trading at $318.17 with a sustained move lower over the past week.
- The stock remains above short-term moving averages but trades below the 200-day, indicating a bearish long-term structure.
- Expected five-day range is $308.78 to $325.58, with mixed momentum signals and key support at $311.24 and resistance at $327.83.
Revenue growth and M&A activity spur cautious optimism amid slower dividend hikes
Home Depot reported second-quarter earnings with revenue reaching $47.86 billion, a 5.7% increase year over year according to Yahoo Finance. The company also completed its acquisition of GMS via its SRS Distribution subsidiary, further expanding its contractor distribution network in the U.S., as noted by kalkinemedia.com. Institutional investors increased or initiated positions in HD during the third quarter, including BG Investment Services LLC, Evergreen Capital Management LLC, Carolina Wealth Advisors LLC, and Miller Howard Investments Inc. NY, according to MarketBeat. Additionally, The Motley Fool highlighted that while dividend payouts have expanded significantly over the past decade, recent hikes have decelerated as the retailer navigates operating pressures.
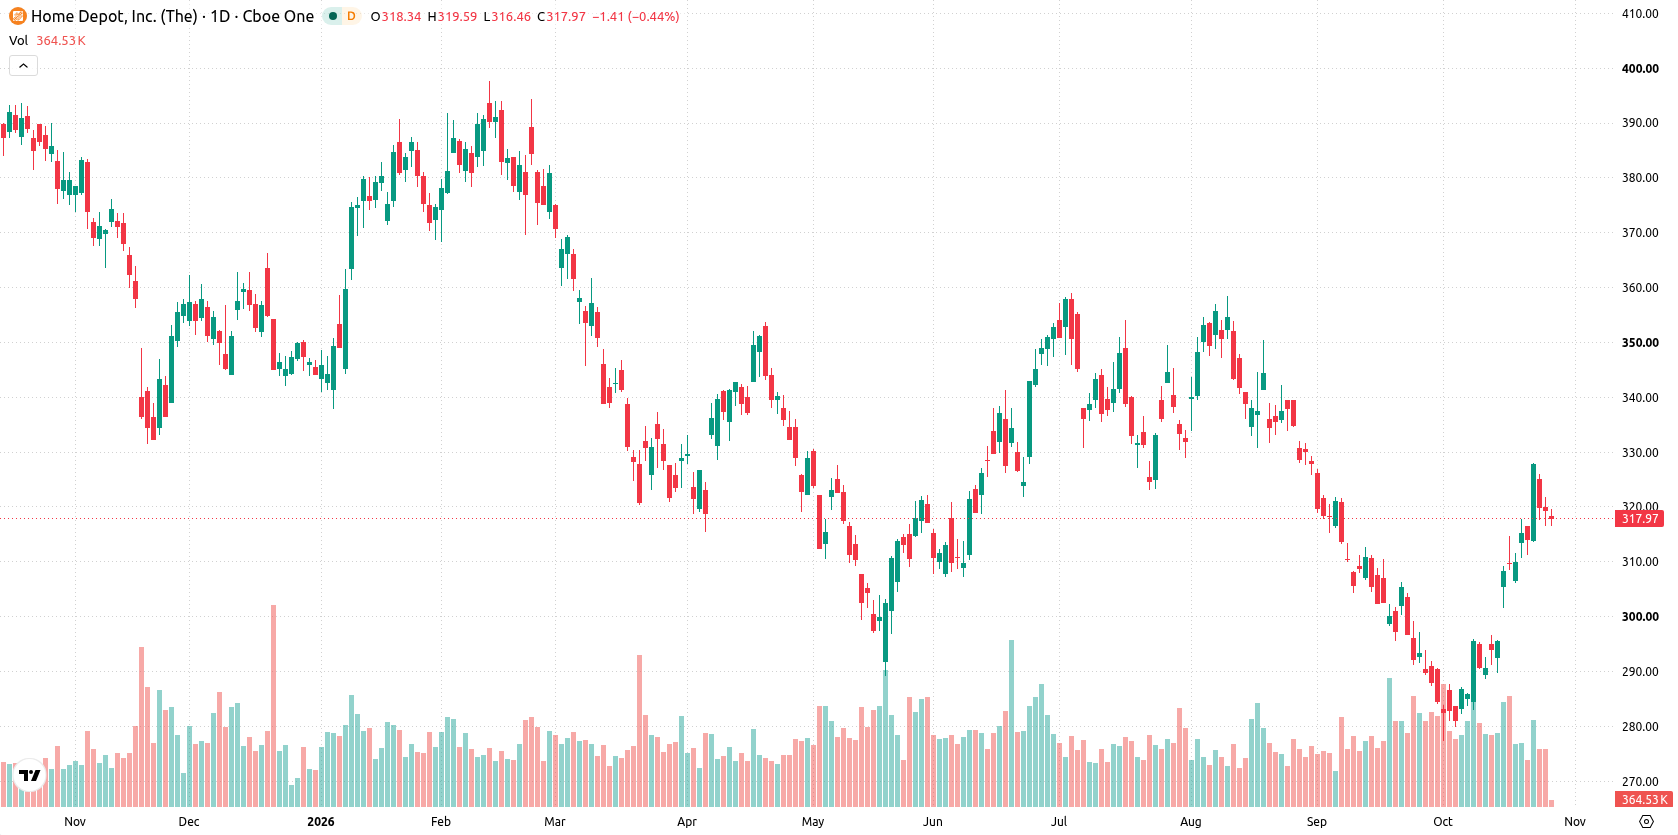
Overbought CCI and mixed oscillators drive technical divergence over the week
On the daily chart, price action is in the middle of the past week's range and maintains a sustained move lower with a firm trend, as supported by a volatility of 5.33%. Momentum signals are mixed: CCI is in overbought territory at 103.52, suggesting some overheating risk, while other level-based oscillators remain neutral. The MACD and Awesome Oscillator both point higher, but the HMA is pointing down, indicating some divergence in short-term momentum signals. Support rests at $311.24, with the Ichimoku Kijun at $302.57 also acting as a practical support level, while resistance lies at $327.83.
Neutral bias prevails as overbought conditions challenge breakout scenarios next week
For the next five trading days, the expected range is $308.78 to $325.58. There is a 68% probability of an increase and a 32% chance of a decrease. The base case sees the stock trading within this range as momentum contends with overbought signals. A clear break above $327.83 would open the way for a bullish scenario, while a drop below $311.24 would put further downside in focus.
Earlier, analysts noted that Home Depot shares were likely to remain range-bound amid consolidation signals, with acquisition activity seen as a potential driver for the professional segment. The latest analysis strengthens this view as conflicting technical indicators and expanded institutional interest support a base-case scenario of continued volatility within the $308.78 to $325.58 range, with traders watching for a decisive break above $327.83 as the next directional catalyst.











-
 Afghanistan
-
 Albania
-
 Algeria
-
 Angola
-
 Argentina
-
 Armenia
-
 Australia
-
 Austria
-
 Azerbaijan
-
 Bahamas
-
 Bahrain
-
 Bangladesh
-
 Belarus
-
 Belgium
-
 Bolivia
-
 Botswana
-
 Brazil
-
 Brunei
-
 Bulgaria
-
 Cambodia
-
 Cameroon
-
 Canada
-
 Chile
-
 China
-
 Colombia
-
 Congo
-
 Costa Rica
-
 Cote d'Ivoire
-
 Croatia
-
 Cuba
-
 Cyprus
-
 Czechia
-
 DR Congo
-
 Denmark
-
 Dominican Republic
-
 Ecuador
-
 Egypt
-
 El Salvador
-
 Estonia
-
 Eswatini
-
 Ethiopia
-
 Finland
-
 France
-
 Georgia
-
 Germany
-
 Ghana
-
 Greece
-
 Haiti
-
 Hong Kong
-
 Hungary
-
 India
-
 Indonesia
-
 Iran, Islamic republic
-
 Iraq
-
 Ireland
-
 Israel
-
 Italy
-
 Jamaica
-
 Japan
-
 Jordan
-
 Kazakhstan
-
 Kenya
-
 Korea
-
 Kuwait
-
 Kyrgyzstan
-
 Laos
-
 Latvia
-
 Lebanon
-
 Lesotho
-
 Libya
-
 Lithuania
-
 Luxembourg
-
 Madagascar
-
 Malaysia
-
 Malta
-
 Mauritius
-
 Mexico
-
 Moldova
-
 Mongolia
-
 Montenegro
-
 Morocco
-
 Mozambique
-
 Myanmar
-
 Namibia
-
 Nepal
-
 Netherlands
-
 New Zealand
-
 Nigeria
-
 North Macedonia
-
 Norway
-
 Oman
-
 Pakistan
-
 Palestine
-
 Panama
-
 Papua New Guinea
-
 Paraguay
-
 Peru
-
 Philippines
-
 Poland
-
 Portugal
-
 Puerto Rico
-
 Qatar
-
 Reunion
-
 Romania
-
 Rwanda
-
 Saudi Arabia
-
 Serbia
-
 Singapore
-
 Slovakia
-
 Slovenia
-
 Somalia
-
 South Africa
-
 Spain
-
 Sri Lanka
-
 Sweden
-
 Switzerland
-
 Syria
-
 Taiwan
-
 Tajikistan
-
 Tanzania
-
 Thailand
-
 Trinidad and Tobago
-
 Tunisia
-
 Turkey
-
 UAE
-
 Uganda
-
 Ukraine
-
 United Kingdom
-
United States
-
 Uruguay
-
 Uzbekistan
-
 Venezuela
-
 Vietnam
-
 Yemen
-
 Zambia
-
 Zimbabwe
- Forex
- Crypto












